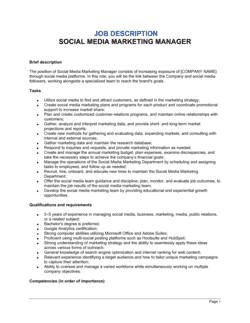
Social Media Marketing Report Template

Free Word download β€’ Edit online β€’ Save & share with Drive β€’ Export to PDF

14 pagesβ€’30–40 min to fillβ€’Difficulty: Complex
Learn more ↓
FreeSocial Media Marketing Report Template

At a glance

What it is
A Social Media Marketing Report is a structured document that consolidates performance data across social channels β€” reach, engagement, follower growth, traffic, and conversions β€” into a single summary for a defined reporting period. This free Word download gives you a ready-to-edit report framework you can populate with your own metrics, customize per channel, and export as PDF to share with clients, leadership, or stakeholders.
When you need it
Use it at the end of any reporting cycle β€” weekly, monthly, or quarterly β€” when you need to present social media results to a client, marketing director, or executive team. It is also the right tool when evaluating whether a campaign hit its targets or when planning budget reallocation across channels.
What's inside
Executive summary, reporting period and objectives, channel-by-channel performance data, audience growth metrics, content performance highlights, paid campaign results, competitive benchmarks, key insights, and recommendations for the next period.

What is a Social Media Marketing Report?

A Social Media Marketing Report is a structured operational document that consolidates performance data from all active social media channels β€” reach, impressions, engagement rate, follower growth, paid campaign results, and conversions β€” into a single summary covering a defined reporting period. It measures actual results against the objectives set at the start of that period, surfaces data-backed insights, and translates those insights into prioritized recommendations for the next cycle. Unlike a live analytics dashboard, a social media report captures a moment in time, tells a coherent performance story, and creates a documented record that can be shared with clients, executives, or stakeholders who do not have direct platform access.

Why You Need This Document

Without a structured report, social media performance data stays locked inside platform dashboards where it is invisible to decision-makers β€” and where it is nearly impossible to tie effort to business outcomes. Teams that skip formal reporting routinely lose budget in the next planning cycle because they cannot demonstrate ROI, and clients who receive only raw numbers without context, benchmarks, or recommendations routinely question the value of their retainer. A well-structured social media marketing report forces the discipline of comparing results against stated objectives, separating paid from organic performance, and identifying which content formats and channels are actually moving the metrics that matter. This template gives you a repeatable reporting framework you can fill in monthly, customize per client or channel, and export as a professional PDF in under four hours.

Which variant fits your situation?

If your situation is…Use this template
Reporting on a single paid social campaign with budget and ROAS dataCampaign Performance Report
Presenting overall digital marketing results across all channelsDigital Marketing Report
Summarizing weekly social activity for an internal team standupWeekly Social Media Report
Delivering a quarterly strategic review to a client or executive boardQuarterly Marketing Report
Reporting influencer partnership results and earned media valueInfluencer Marketing Report
Benchmarking social performance against competitors for a pitchCompetitive Analysis Report
Tracking content calendar execution and organic post performance onlyContent Marketing Report

Common mistakes to avoid

❌ Blending paid and organic metrics into combined totals

Why it matters: Paid reach can inflate organic-looking numbers by 300–500%, masking poor organic performance and leading to budget decisions based on misleading data.

Fix: Always report paid and organic metrics in separate rows or sections, and calculate engagement rate on organic reach only when assessing content quality.

❌ Reporting numbers without period-over-period comparisons

Why it matters: A standalone metric like '42,000 impressions' is meaningless without context β€” it could represent 20% growth or a 30% decline depending on the prior period.

Fix: Add a comparison column showing the prior period value and the percentage change for every key metric in the channel summary table.

❌ Omitting the original objectives from the report

Why it matters: Without stated goals, stakeholders cannot assess performance β€” a 2% engagement rate looks different depending on whether the target was 1.5% or 4%.

Fix: Always record the objectives agreed at the previous reporting cycle in the report header before any results data appears.

❌ Writing vague insights without supporting numbers

Why it matters: Observations like 'video content resonated well' give stakeholders no basis for making budget or content decisions in the next period.

Fix: Quantify every insight: 'Video posts generated a 4.8% engagement rate vs. 1.9% for static images, across 12 posts this period.'

❌ Skipping the competitive benchmark section

Why it matters: Internal metrics alone cannot tell a stakeholder whether a 3% engagement rate is exceptional or mediocre β€” industry context is required to make that judgment.

Fix: Include at least two competitor profiles or an industry benchmark figure for engagement rate and follower growth, sourced from a named tool or report.

❌ Leaving recommendations without owners or deadlines

Why it matters: Unassigned recommendations have a near-zero implementation rate β€” they reappear unchanged in the next report while performance stagnates.

Fix: Assign a named owner and a target completion date or next-report checkpoint to every recommendation before the report is shared.

The 9 key sections, explained

Executive Summary

Reporting Period and Objectives

Channel Performance Summary

Audience Growth and Demographics

Content Performance Highlights

Paid Campaign Results

Competitive Benchmark

Key Insights

Recommendations and Next Period Plan

How to fill it out

  1. 1

    Define the reporting period and pull raw data

    Set the exact start and end dates and export platform analytics from each channel's native dashboard β€” Meta Business Suite, LinkedIn Analytics, TikTok Analytics, and any third-party tool like Sprout Social or Hootsuite.

    πŸ’‘ Export data on the same calendar day each month to avoid timezone discrepancies that shift the final day's numbers between reports.

  2. 2

    Document the objectives that were set before the period began

    Retrieve the goals agreed upon at the last reporting cycle β€” follower growth targets, engagement rate benchmarks, traffic or conversion goals β€” and paste them into the objectives section before adding results.

    πŸ’‘ If no formal objectives were set, state that explicitly and use this report to establish baselines for the next period.

  3. 3

    Complete the channel performance table

    Enter reach, impressions, engagements, engagement rate, link clicks, and follower count for each active platform. Calculate period-over-period change as a percentage for each metric.

    πŸ’‘ Color-code cells green (above target), yellow (within 10% of target), and red (below target) to make the summary scannable for executive reviewers.

  4. 4

    Pull audience demographics and growth data

    Export audience composition data from each platform and note any shifts in top age brackets, gender split, or geographic concentration compared with the prior period.

    πŸ’‘ Flag any demographic shift of more than five percentage points β€” it often signals that a high-reach post attracted an off-target audience.

  5. 5

    Select and annotate top content

    Identify the top three to five posts by each priority metric and write one sentence per post explaining the likely performance driver β€” format, topic, timing, or paid boost.

    πŸ’‘ Screenshot the actual post alongside the metrics so stakeholders can see what the content looked like without needing platform access.

  6. 6

    Enter paid campaign data separately

    Pull spend, impressions, CTR, CPC, and conversion data from Ads Manager for each campaign and record it in the paid section β€” never blend with organic totals.

    πŸ’‘ Include the campaign objective (awareness, traffic, or conversion) next to each campaign name so stakeholders can apply the right benchmark for each metric.

  7. 7

    Write insights before recommendations

    Draft three to five data-backed insight statements, each tied to a specific number. Only after the insights are written should you draft the recommendations that follow from them.

    πŸ’‘ Each recommendation should reference a specific insight by number β€” 'Based on Insight 2, we recommend...' β€” to make the logical connection explicit.

  8. 8

    Write the executive summary last

    Summarize the period in three to five sentences: overall performance vs. objectives, the single strongest result, the biggest gap, and the top recommendation.

    πŸ’‘ Keep the executive summary to half a page. If the reader wants details, the body of the report provides them.

Frequently asked questions

What is a social media marketing report?

A social media marketing report is a structured document that consolidates performance data across social platforms β€” including reach, engagement, follower growth, paid campaign results, and conversions β€” for a defined time period. It compares results against objectives set at the start of the period, surfaces insights from the data, and recommends actions for the next cycle. It is used by social media managers, agencies, and marketing leaders to evaluate strategy and justify investment.

What should a social media report include?

A complete report covers the reporting period and original objectives, channel-by-channel performance metrics (reach, impressions, engagement rate, follower growth, link clicks), audience demographics, top-performing content, paid campaign results with spend and ROAS, competitive benchmarks, data-backed insights, and prioritized recommendations with named owners. Reports that omit objectives or competitive context make it impossible to judge whether results are strong or weak.

How often should a social media marketing report be produced?

Monthly reports are the most common cadence for ongoing client retainers and internal marketing teams. Quarterly reports are appropriate for executive or board-level audiences who need strategic context rather than granular data. Weekly reports suit active campaign periods or high-frequency posting schedules where rapid iteration matters. The cadence should match how quickly decisions will be made based on the data.

What metrics should be included in a social media report?

Core metrics to include: reach and impressions per channel, engagement rate (engagements divided by reach), follower net growth and growth rate, link clicks and click-through rate, and β€” for paid activity β€” spend, CPC, CPM, conversions, and ROAS. Secondary metrics like video completion rate, story views, and share of voice add depth when they are tied to specific objectives. Only report metrics that were part of the original goals or that explain a meaningful trend.

What is the difference between reach and impressions?

Reach counts the number of unique users who saw a piece of content. Impressions count every time the content was displayed, including multiple views by the same user. A post with 10,000 impressions and 6,000 reach means users saw it an average of 1.67 times each. For most engagement rate calculations, reach is the more accurate denominator because it reflects how many distinct people interacted with the content.

How do I show ROI in a social media report?

Tie social media activity to revenue-adjacent outcomes: website sessions from social referral, leads or form fills attributed to social, and β€” for paid campaigns β€” ROAS (revenue divided by ad spend). For organic content, track assisted conversions using UTM parameters and attribute them to the correct channel in Google Analytics or your CRM. Engagement and reach alone do not constitute ROI β€” connect them to a conversion event with a dollar value attached.

How do I benchmark social media performance?

Compare your metrics against two sources: your own prior-period results (trend analysis) and external industry benchmarks. Engagement rate benchmarks vary significantly by platform and industry β€” a 1–3% rate is typical on Instagram for most B2C brands, while LinkedIn averages closer to 0.5–1%. Tools like Rival IQ, Sprout Social, and HubSpot publish annual benchmark reports by industry that are reliable reference points for client-facing reports.

Can this template be used for client reporting at an agency?

Yes β€” the template is structured to work for agency client deliverables. Add the client's branding (logo, colors) to the header, populate the channel sections with the client's platform data, and include the competitive benchmark section using the client's named competitors. The recommendations section is particularly valuable in a client context because it demonstrates strategic thinking beyond data transcription and justifies the ongoing retainer.

What tools should I use to gather data for the report?

Pull platform-native data first: Meta Business Suite for Facebook and Instagram, LinkedIn Analytics, TikTok Analytics, and X Analytics. For cross-channel aggregation, tools like Sprout Social, Hootsuite, or Buffer save significant time. For website attribution, use Google Analytics 4 with UTM-tagged social links. For competitive data, Rival IQ and Brandwatch provide channel-level benchmarks against named competitors.

How this compares to alternatives

vs Digital Marketing Report

A digital marketing report covers all online channels β€” SEO, paid search, email, display, and social β€” in a single document. A social media marketing report focuses exclusively on social platforms. Use the social report for channel-specific deep dives and the digital marketing report when presenting an integrated view of the full marketing mix to senior leadership.

vs Marketing Plan

A marketing plan sets forward-looking strategy, goals, and budget allocation for a defined period. A social media marketing report looks backward, measuring results against those goals. The two documents are companion pieces β€” the plan defines what success looks like; the report measures whether it was achieved.

vs Campaign Performance Report

A campaign performance report focuses on a single paid or organic campaign with a defined flight, budget, and objective. A social media marketing report covers all activity across all channels for a recurring period, regardless of whether it was campaign-driven or always-on. Use the campaign report for post-mortems on specific initiatives and the social report for ongoing channel management.

vs Quarterly Marketing Report

A quarterly marketing report aggregates performance across all marketing activities β€” social, email, SEO, events β€” at a strategic summary level for executive or board audiences. A social media marketing report provides channel-level granularity on a monthly cadence for operational decision-making. The quarterly report often draws on data from the monthly social reports as source material.

Industry-specific considerations

Retail and E-commerce

Reports emphasize paid social ROAS, product-specific campaign performance, and the link between social traffic and purchase conversion rate.

SaaS and Technology

Focus on LinkedIn engagement for B2B lead generation, trial signups attributed to social referral, and content performance by buyer-funnel stage.

Professional Services

LinkedIn dominates reporting; metrics center on thought-leadership post reach, profile visits, and inbound inquiries sourced from social content.

Food and Beverage

Instagram and TikTok visuals drive the report; key metrics are story views, saves, user-generated content volume, and foot-traffic or delivery attribution.

Healthcare and Wellness

Reports track patient education content reach, appointment booking clicks, and compliance with platform advertising restrictions on health claims.

Nonprofit and Education

Metrics focus on community growth, volunteer or donor campaign reach, event promotion performance, and organic engagement with mission-driven content.

Template vs pro β€” what fits your needs?

PathBest forCostTime
Use the templateSocial media managers, small business owners, and freelancers producing recurring channel reportsFree2–4 hours per report once data is pulled
Template + professional reviewAgencies delivering client-facing reports where presentation quality affects contract renewal$200–$500 for a designer or analyst to brand and automate the template1–2 days for initial setup; 1–2 hours per reporting cycle thereafter
Custom draftedEnterprise marketing teams or agencies managing 10+ clients who need automated, API-connected reporting dashboards$2,000–$10,000+ for a custom dashboard build in Looker Studio, Tableau, or a reporting platform2–6 weeks for initial build

Glossary

Reach
The total number of unique users who saw a post or piece of content during the reporting period.
Impressions
The total number of times content was displayed, including multiple views by the same user β€” always equal to or greater than reach.
Engagement Rate
Likes, comments, shares, and saves divided by reach or followers, expressed as a percentage β€” the standard measure of audience interaction quality.
Click-Through Rate (CTR)
The percentage of users who clicked a link or call-to-action after seeing a post, calculated as clicks divided by impressions.
Follower Growth Rate
The net increase in followers over a period, divided by the starting follower count, expressed as a percentage.
Cost Per Click (CPC)
Total paid campaign spend divided by the number of link clicks generated β€” a standard efficiency metric for paid social advertising.
Return on Ad Spend (ROAS)
Revenue attributed to paid social campaigns divided by the amount spent on those campaigns, expressed as a ratio or multiple.
Share of Voice
Your brand's social mentions or content volume as a percentage of total mentions in your category or competitive set.
Earned Media Value (EMV)
A dollar estimate of the organic reach and engagement a brand received, calculated by applying a cost-per-equivalent-impression rate to unpaid exposure.
Conversion
A completed goal action attributed to a social media touchpoint β€” a form fill, purchase, trial signup, or email subscription.
Reporting Period
The defined time window the report covers β€” typically the trailing 7, 30, or 90 days, or a specific campaign flight.

Part of your Business Operating System

This document is one of 3,000+ business & legal templates included in Business in a Box.

  • Fill-in-the-blanks β€” ready in minutes
  • 100% customizable Word document
  • Compatible with all office suites
  • Export to PDF and share electronically

Create your document in 3 simple steps.

From template to signed document β€” all inside one Business Operating System.
1
Download or open template

Access over 3,000+ business and legal templates for any business task, project or initiative.

2
Edit and fill in the blanks with AI

Customize your ready-made business document template and save it in the cloud.

3
Save, Share, Send, Sign

Share your files and folders with your team. Create a space of seamless collaboration.

Save time, save money, and create top-quality documents.

β˜…β˜…β˜…β˜…β˜…

"Fantastic value! I'm not sure how I'd do without it. It's worth its weight in gold and paid back for itself many times."

Managing Director Β· Mall Farm
Robert Whalley
Managing Director, Mall Farm Proprietary Limited
β˜…β˜…β˜…β˜…β˜…

"I have been using Business in a Box for years. It has been the most useful source of templates I have encountered. I recommend it to anyone."

Business Owner Β· 4+ years
Dr Michael John Freestone
Business Owner
β˜…β˜…β˜…β˜…β˜…

"It has been a life saver so many times I have lost count. Business in a Box has saved me so much time and as you know, time is money."

Owner Β· Upstate Web
David G. Moore Jr.
Owner, Upstate Web

Run your business with a system β€” not scattered tools

Stop downloading documents. Start operating with clarity. Business in a Box gives you the Business Operating System used by over 250,000 companies worldwide to structure, run, and grow their business.

Start freeΒ Β·Β No credit card required