1
Lock the reporting period and fiscal calendar
Confirm the exact start and end dates of the quarter being reported and verify they align with your fiscal year definition. Label every table and chart consistently — 'Q2 FY2026 (April 1 – June 30, 2026)' — so recipients cannot misread the period.
💡 If your fiscal year does not follow the calendar year, add a one-line note in the header clarifying the fiscal calendar to avoid confusion for external readers.
2
Pull actuals from your accounting system
Export revenue, gross profit, operating expenses, EBITDA, and cash position as of the last day of the quarter. Confirm the figures are final and reconciled — not draft management accounts — before populating the financial highlights section.
💡 Set a hard close date for the accounting period — typically 10 business days after quarter-end — so the report is based on final numbers, not estimates.
3
Populate the financial highlights table with variances
For each financial metric, enter the actual figure, the approved budget figure, and the prior-quarter actual. Calculate the variance in both dollar and percentage terms. Add a one-sentence explanation for any variance greater than 10%.
💡 Use consistent sign conventions — negative variances in red, positive in black — and keep them the same every quarter so readers can scan instantly.
4
Update the operational KPI scorecard
Enter the actual result for each KPI alongside the quarter's target. Flag any metric that missed target by more than 15% for a brief explanation in the departmental updates section.
💡 Resist the urge to add new KPIs when existing ones underperform. Consistency across quarters is worth more than optimizing the scorecard for a single period.
5
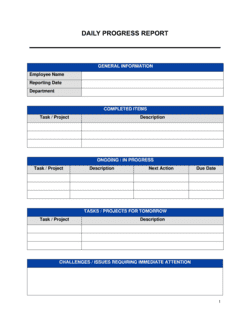
Collect and standardize departmental updates
Send each department head a two-field prompt: (1) top result from the quarter with one supporting metric, and (2) top priority for next quarter. Edit responses to a consistent length and format before inserting them into the report.
💡 Cap each departmental entry at 100 words. Anything longer belongs in a separate departmental report, not the quarterly summary.
6
Refresh the risk register and strategic initiative statuses
Review each risk and initiative from the prior quarter's report. Update the RAG status, add a one-sentence progress note, and confirm the next milestone date. Add any new risks that emerged during the quarter.
💡 If a risk has been green for three consecutive quarters with no change, either close it formally or explain why it remains open — stale entries undermine the section's credibility.
7
Write the outlook section with a range, not a point estimate
State next-quarter revenue guidance as a range (e.g., '$1.2M–$1.4M') with the two or three key assumptions driving it. List 2–3 watch items — risks or opportunities that could move results outside the range.
💡 Include the date of the data cut underpinning the guidance. Pipeline and backlog change daily; anchoring the estimate to a specific date manages expectations if circumstances shift before you present.
8
Write the executive summary last
Pull the single most important data point from each section and compress them into one cohesive half-page. The summary should be complete enough that a time-pressed board member gets the full picture without reading further.
💡 If you cannot summarize the quarter in under 250 words, the underlying sections contain too much detail — edit the body, not the summary.