Worksheet_Industry & Competitive Forces Analysis

Free download β€’ Use as a template β€’ Print or share

2 pagesβ€’20–25 min to useβ€’Difficulty: Standard
Learn more ↓
FreeWorksheet_Industry & Competitive Forces Analysis Template

At a glance

What it is
A Worksheet Industry & Competitive Forces Analysis is a structured template that guides you through evaluating the five forces that shape profitability in any industry: competitive rivalry, supplier power, buyer power, threat of new entrants, and threat of substitutes. This free Word download gives you a section-by-section framework you can edit online and export as PDF to share with leadership teams, boards, or investors.
When you need it
Use it when entering a new market, launching a product, preparing a business plan, or conducting an annual strategic review. It is also the right tool when your margins are under pressure and you need to diagnose the structural source β€” not just the symptoms.
What's inside
Industry definition and scope, scoring guides for each of the five competitive forces, a force intensity summary, strategic implications, and an action-planning section that translates findings into concrete priorities.

What is a Worksheet Industry & Competitive Forces Analysis?

A Worksheet Industry & Competitive Forces Analysis is a structured operational template that guides analysts, strategists, and business owners through a systematic evaluation of the five forces that determine long-term profitability in any industry: competitive rivalry, supplier power, buyer power, threat of new entrants, and threat of substitutes. Rooted in Michael Porter's Five Forces framework, it converts qualitative industry knowledge into scored, comparable assessments and links those scores directly to strategic implications and action priorities. This free Word download provides a section-by-section structure you can complete in a focused work session, edit online, and export as PDF for board presentations, investor packages, or internal strategy reviews.

Why You Need This Document

Without a structured forces analysis, strategy decisions rest on anecdote and intuition β€” and the forces most likely to erode your margins are the ones easiest to rationalize away. Companies enter attractive-looking markets without recognizing that concentrated buyers will immediately compress pricing. Businesses mistake strong current profits for structural advantage when, in reality, low new-entrant barriers mean three well-funded competitors are 18 months behind them. A completed competitive forces worksheet surfaces these structural realities before capital is committed and forces are entrenched. It also creates a documented baseline you can re-score annually to detect deteriorating conditions early β€” when you still have time to respond β€” rather than after margins have already collapsed. This template gives you the scoring framework, section structure, and action-planning format to move from raw industry data to a prioritized strategic agenda in a single working session.

Which variant fits your situation?

If your situation is…Use this template
Quick internal alignment without full scoring detailSWOT Analysis
Benchmarking your position against named rivals onlyCompetitive Analysis Matrix
Mapping macro-environmental factors beyond industry structurePESTLE Analysis
Incorporating industry analysis into a full business planBusiness Plan
Assessing a specific competitor in depthCompetitor Profile Worksheet
Translating industry findings into a multi-year growth roadmapStrategic Planning Template
Evaluating an acquisition or partnership target's market positionMarket Analysis Report

Common mistakes to avoid

❌ Defining the industry too broadly

Why it matters: An overly broad scope β€” 'software' or 'healthcare' β€” makes all five forces score high simultaneously, producing an analysis too generic to inform any specific decision.

Fix: Narrow the definition until a single sentence specifies the product, customer segment, and geography. If the definition would apply to 500 companies, it is still too broad.

❌ Scoring forces from intuition alone

Why it matters: Gut-feel scores reflect internal biases and often underestimate forces that are uncomfortable to confront β€” particularly buyer power in customer-concentrated businesses.

Fix: Require at least two external data points per force before assigning a score: industry reports, customer surveys, supplier interviews, or financial benchmarking data.

❌ Stopping at the summary table without writing implications

Why it matters: A table of five numbers without interpretation tells leadership nothing about what to do differently β€” the analysis becomes a compliance exercise rather than a decision tool.

Fix: Write at least two sentences of plain-language implication for every force scoring 4 or 5, linked directly to a specific strategic or operational decision.

❌ Running the analysis once and treating it as permanent

Why it matters: Industry forces shift β€” new entrant barriers collapse, buyer consolidation accelerates, disruptive substitutes emerge. A three-year-old analysis can actively mislead strategy decisions.

Fix: Schedule an annual re-score, and trigger an ad hoc update whenever a competitor is acquired, a major new entrant appears, or a key customer relationship changes materially.

❌ Failing to assign action owners after the analysis

Why it matters: Strategic analyses without named owners and deadlines are filed and forgotten β€” typically within 30 days of the workshop that produced them.

Fix: Before closing the worksheet, assign each action item to a specific person with a completion date and a success metric, and add it to the leadership team's agenda.

❌ Treating all five forces as equally weighted

Why it matters: In asset-heavy industries, supplier power may dwarf rivalry; in platform businesses, the threat of substitutes may be the only force that matters. Equal weighting produces a misleading average.

Fix: After scoring, explicitly note which one or two forces are most structurally determinative for your business model, and weight strategy decisions accordingly.

The 9 key sections, explained

Industry definition and scope

Competitive rivalry assessment

Supplier power assessment

Buyer power assessment

Threat of new entrants assessment

Threat of substitutes assessment

Force intensity summary

Strategic implications

Action priorities and owners

How to fill it out

  1. 1

    Define the industry scope precisely

    Before scoring anything, write a one-sentence definition of the industry that specifies product or service category, target customer, and geography. Review it with at least one other stakeholder before proceeding.

    πŸ’‘ If two team members define the industry differently, your force scores will not be comparable β€” resolve scope disagreements in step 1, not after the analysis is done.

  2. 2

    Gather data for each force before scoring

    Use industry reports, trade association data, customer interviews, and supplier conversations to collect factual inputs. Assign a score of 1 (low threat) to 5 (high threat) only after reviewing at least two data points per force.

    πŸ’‘ Score each force independently β€” do not let your intuition about overall industry attractiveness bias individual scores up or down.

  3. 3

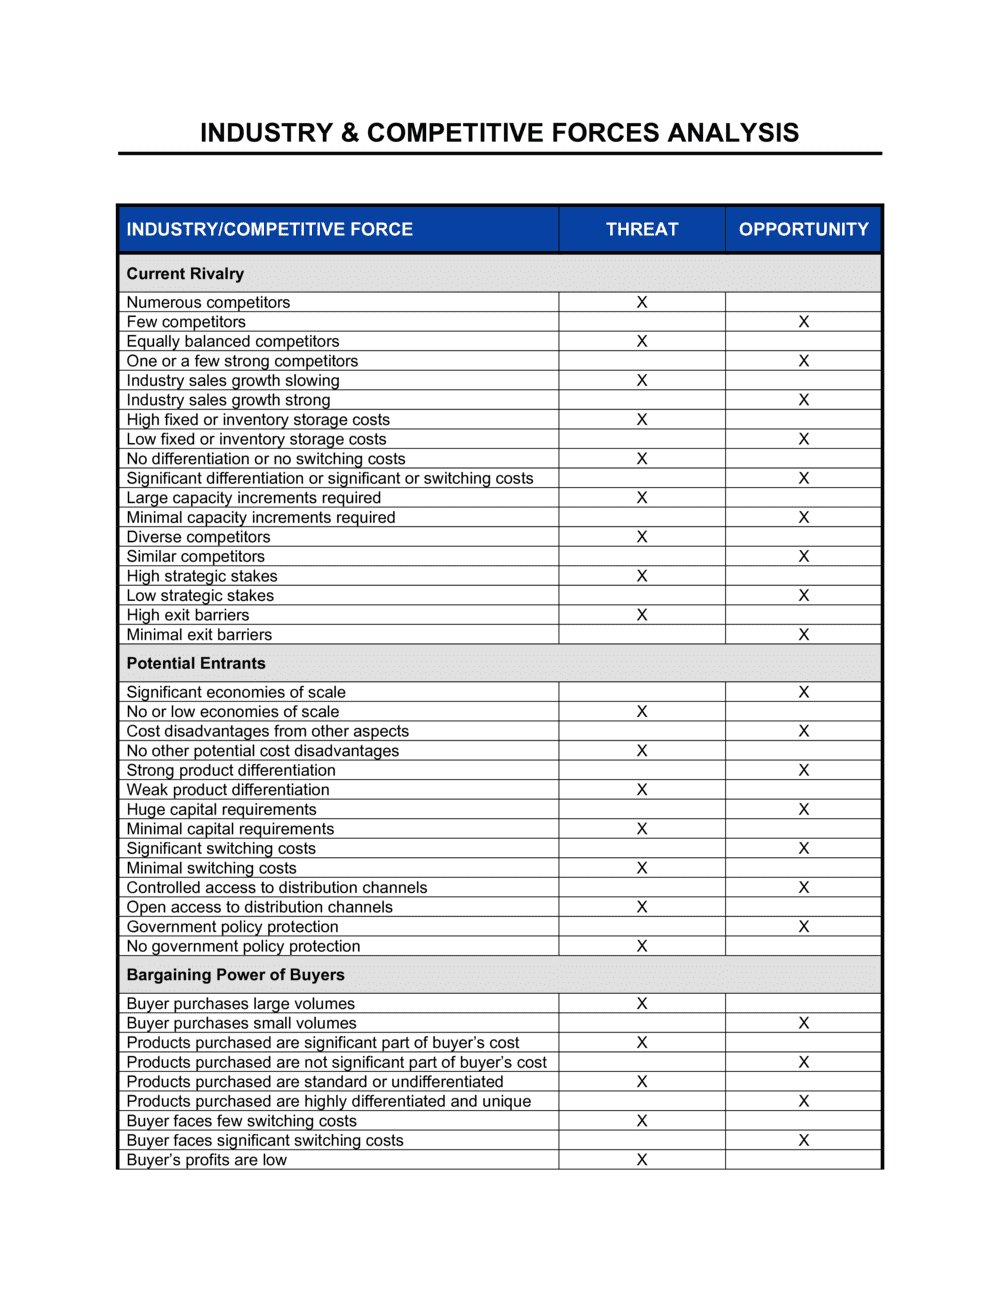
    Score competitive rivalry

    Count direct competitors, note market concentration (top-3 share), check the industry's 3-year revenue CAGR, and assess product differentiation. Enter your score and list the two main drivers.

    πŸ’‘ A declining-growth industry with undifferentiated products and high fixed costs almost always scores 4 or 5 on rivalry β€” use those benchmarks to calibrate.

  4. 4

    Score supplier and buyer power

    For supplier power, check how many alternative suppliers exist and estimate your switching cost. For buyer power, identify what percentage of your revenue comes from your top five accounts and how easily they could switch.

    πŸ’‘ If your top three customers represent more than 40% of revenue, buyer power is high regardless of other factors β€” mark it 4 or 5.

  5. 5

    Score new entrant and substitute threats

    For new entrants, list every barrier and estimate the minimum capital needed to compete at your scale. For substitutes, list at least three alternatives that fulfill the same customer job-to-be-done, even from adjacent industries.

    πŸ’‘ Search for venture capital investment in adjacent categories β€” if VCs are funding companies solving your customer's problem from a different angle, the substitute threat is higher than incumbents typically assume.

  6. 6

    Complete the force intensity summary

    Transfer the five scores to the summary table and calculate the average. Flag any force scoring 4 or 5 as a priority threat. Add an overall industry attractiveness rating: 1–2 average = high attractiveness, 3 = medium, 4–5 = low.

    πŸ’‘ Compare this analysis to last year's if one exists β€” a rising score on any single force is an early warning signal even if the average looks stable.

  7. 7

    Write strategic implications for each high-scoring force

    For every force rated 4 or 5, write two to three sentences explaining what specifically drives the score and what that means for your pricing, positioning, or investment decisions.

    πŸ’‘ Name the specific companies, customers, or suppliers driving each high score β€” anonymous force descriptions produce generic strategy.

  8. 8

    Assign action items with owners and deadlines

    Convert each implication into at least one concrete action with a named owner, a completion date, and a measurable output. Review these in your next leadership meeting.

    πŸ’‘ Limit total actions to eight or fewer β€” more than eight items signals an analysis that has not been prioritized and will be ignored in execution.

Frequently asked questions

What is a competitive forces analysis worksheet?

A competitive forces analysis worksheet is a structured template for systematically evaluating the five forces that determine profitability in any industry: competitive rivalry, supplier power, buyer power, threat of new entrants, and threat of substitutes. Based on Michael Porter's Five Forces framework, it converts qualitative judgments into scored assessments and translates them into strategic priorities. It is used by strategists, founders, and consultants to diagnose industry structure before making investment, pricing, or positioning decisions.

What are the five competitive forces?

The five forces are competitive rivalry (intensity among existing players), supplier power (leverage of input providers), buyer power (leverage of customers), threat of new entrants (ease of entry for new competitors), and threat of substitutes (risk of customers switching to alternative solutions). Each force is rated independently, typically on a 1-to-5 scale, and the combination determines overall industry attractiveness. Industries where all five forces are high tend to be structurally unattractive for sustained profitability.

When should I use this worksheet?

Use it before entering a new market, launching a new product line, preparing a business plan for investors or lenders, conducting an annual strategic review, or investigating why margins are declining. It is also appropriate when evaluating an acquisition target, assessing a potential partnership, or stress-testing an existing competitive strategy against structural industry dynamics.

How is this worksheet different from a SWOT analysis?

A SWOT analysis captures internal strengths and weaknesses alongside external opportunities and threats from any source β€” it is broad and relatively open-ended. A competitive forces worksheet focuses exclusively on the structural forces external to the firm that determine industry-wide profitability. The two tools are complementary: run the competitive forces analysis first to understand the industry structure, then use SWOT to assess how your specific capabilities fit within that structure.

How long does it take to complete this analysis?

A thorough analysis with supporting data typically takes 4–8 hours for a single analyst familiar with the industry, or a half-day workshop for a cross-functional team. First-time analysts or those entering an unfamiliar industry should budget an additional 4–8 hours for research. A well-structured template reduces the framing time significantly β€” most of the work is gathering the factual inputs, not deciding what to ask.

How often should this analysis be updated?

A full re-score annually aligned to strategic planning is standard practice. Trigger an ad hoc update when a major competitor is acquired or exits, when a disruptive new entrant is funded, when a key customer or supplier relationship changes materially, or when your gross margin shifts by more than 3–5 percentage points in a single year. Industry structures can change faster than annual planning cycles in technology and platform markets.

Can I use this worksheet for multiple industries at once?

Complete a separate worksheet for each distinct industry or market segment you are evaluating. Combining two industries into one analysis produces force scores that average out structural differences and obscure the specific threats each market presents. If you are evaluating market entry across three geographies, run three separate analyses and compare the summary scores side by side.

What data sources should I use to score the forces?

Reliable sources include industry research reports (IBISWorld, Statista, Mintel), trade association publications, SEC or SEDAR filings of public competitors, customer win/loss interviews, supplier pricing conversations, and patent database searches for proprietary technology barriers. For new entrant threats, venture capital funding databases (Crunchbase, PitchBook) reveal which adjacent categories are attracting investment capital that could flow into your market.

Is this analysis useful for small businesses, or is it only for large corporations?

It is equally useful for small businesses β€” and arguably more urgent, since small firms have fewer resources to absorb structural deterioration. A local professional services firm needs to understand whether digital platforms are eroding switching costs for its clients just as much as a Fortune 500 company does. The scoring calibration differs by scale, but the framework applies to any business competing in a defined market.

How this compares to alternatives

vs SWOT Analysis

A SWOT analysis is broader and internally focused β€” it captures company-specific strengths and weaknesses alongside external opportunities and threats from any source. A competitive forces worksheet is narrower and externally focused, examining only the structural forces that shape industry-wide profitability. Use competitive forces analysis first to understand the landscape, then SWOT to assess how your firm fits within it.

vs PESTLE Analysis

A PESTLE analysis maps macro-environmental factors β€” political, economic, social, technological, legal, and environmental β€” that affect any business operating in a given context. A competitive forces worksheet drills down into the specific structural dynamics of one industry. PESTLE is the wider lens; competitive forces is the industry-specific zoom. Both are inputs to a complete strategic situation assessment.

vs Competitive Analysis Matrix

A competitive analysis matrix benchmarks named competitors on specific product, pricing, and capability dimensions. A competitive forces worksheet does not focus on individual rivals β€” it analyzes the structural forces that determine whether any firm in the industry can sustain profitability. Use the forces worksheet to decide whether to compete; use the matrix to decide how to compete.

vs Strategic Planning Template

A strategic plan translates goals, initiatives, KPIs, and resource allocation into a multi-year roadmap for an existing business. A competitive forces worksheet is an analytical input to that plan β€” it diagnoses the environment the plan must navigate. The two documents are sequential: complete the forces analysis before drafting the strategic plan, then reference its findings in the situation assessment section.

Industry-specific considerations

Technology / SaaS

Substitute threat from adjacent platforms and open-source alternatives is the dominant force; new entrant barriers via switching costs and network effects are the primary defense to quantify.

Manufacturing

Supplier power over raw materials and components is typically the most consequential force; tier-2 supplier dependency and commodity price pass-through are the key scoring inputs.

Retail / E-commerce

Buyer power is elevated by low switching costs and price transparency; competitive rivalry intensity is assessed using category-level margin compression trends rather than competitor headcount alone.

Professional Services

Threat of substitution by technology platforms (legal tech, accounting software, consulting AI tools) is the fastest-moving force; buyer power scoring should weight client concentration heavily.

Healthcare / MedTech

Regulatory approval requirements create high new-entrant barriers that must be scored separately from capital barriers; buyer power analysis must distinguish between end patients, payers, and institutional procurement.

Food & Beverage

Retailer concentration creates extreme buyer power in consumer packaged goods; commodity input pricing means supplier power fluctuates seasonally and must be scored using 3-year price volatility data, not a single-point estimate.

Template vs pro β€” what fits your needs?

PathBest forCostTime
Use the templateStrategy managers, founders, and business owners conducting internal annual reviews or preparing a business planFree4–8 hours
Template + professional reviewTeams entering unfamiliar industries or preparing analysis for investor or board presentations$500–$2,000 for a strategy consultant or industry analyst review1–2 weeks
Custom draftedM&A due diligence, market entry feasibility studies, or strategic decisions involving capital allocation above $1M$5,000–$25,000 for a full consultant-led industry analysis engagement3–6 weeks

Glossary

Five Forces Framework
A model developed by Michael Porter that identifies five structural forces determining the competitive intensity and profitability of an industry.
Competitive Rivalry
The intensity of direct competition among existing players in an industry, driven by the number of competitors, growth rate, and switching costs.
Supplier Power
The ability of input suppliers to raise prices or reduce quality, increasing costs for businesses in the industry.
Buyer Power
The leverage customers hold to push prices down, demand higher quality, or play competitors against each other.
Threat of New Entrants
The likelihood that new competitors will enter the industry, intensifying rivalry and eroding incumbent margins.
Threat of Substitutes
The risk that customers will switch to a different product or service that fulfills the same need, even if it is not a direct competitor.
Barriers to Entry
Structural obstacles β€” capital requirements, regulation, proprietary technology, brand loyalty β€” that make it difficult for new firms to enter an industry.
Switching Costs
The time, money, or effort a buyer must expend to change from one supplier or product to another.
Industry Attractiveness
An overall assessment of how structurally favorable an industry is for earning above-average profits, based on the combined intensity of the five forces.
Force Intensity Score
A numeric rating β€” typically 1 (low threat) to 5 (high threat) β€” assigned to each competitive force to enable cross-force comparison and trend tracking.

Part of your Business Operating System

This document is one of 3,000+ business & legal templates included in Business in a Box.

  • Fill-in-the-blanks β€” ready in minutes
  • 100% customizable Word document
  • Compatible with all office suites
  • Export to PDF and share electronically

Create your document in 3 simple steps.

From template to signed document β€” all inside one Business Operating System.
1
Download or open template

Access over 3,000+ business and legal templates for any business task, project or initiative.

2
Edit and fill in the blanks with AI

Customize your ready-made business document template and save it in the cloud.

3
Save, Share, Send, Sign

Share your files and folders with your team. Create a space of seamless collaboration.

Save time, save money, and create top-quality documents.

β˜…β˜…β˜…β˜…β˜…

"Fantastic value! I'm not sure how I'd do without it. It's worth its weight in gold and paid back for itself many times."

Managing Director Β· Mall Farm
Robert Whalley
Managing Director, Mall Farm Proprietary Limited
β˜…β˜…β˜…β˜…β˜…

"I have been using Business in a Box for years. It has been the most useful source of templates I have encountered. I recommend it to anyone."

Business Owner Β· 4+ years
Dr Michael John Freestone
Business Owner
β˜…β˜…β˜…β˜…β˜…

"It has been a life saver so many times I have lost count. Business in a Box has saved me so much time and as you know, time is money."

Owner Β· Upstate Web
David G. Moore Jr.
Owner, Upstate Web

Run your business with a system β€” not scattered tools

Stop downloading documents. Start operating with clarity. Business in a Box gives you the Business Operating System used by over 250,000 companies worldwide to structure, run, and grow their business.

Free Forever PlanΒ Β·Β No credit card required