Financial Ratio Calculator Template

Free Excel download β€’ Use online β€’ Print or share

5 pagesβ€’25–35 min to useβ€’Difficulty: Complexβ€’Signature requiredβ€’Legal review recommended
Learn more ↓
FreeXLSFinancial Ratio Calculator Template

At a glance

What it is
A Financial Ratio Calculator is a structured analytical document that computes and presents key liquidity, profitability, leverage, and efficiency ratios derived from a company's financial statements. This free Word download gives you a ready-to-complete template you can fill with figures from your balance sheet and income statement, then export as PDF to share with lenders, investors, or your board.
When you need it
Use it when preparing for a bank loan application, investor due diligence, annual financial review, or internal performance benchmarking. It is also required by many lenders as part of covenant compliance reporting on an ongoing quarterly or annual basis.
What's inside
The template organizes financial ratios into four categories β€” liquidity, profitability, leverage, and efficiency β€” each with the relevant input figures, the formula, the calculated result, and an industry benchmark for comparison. A summary section collects all ratios in a single table for quick review by external stakeholders.

What is a Financial Ratio Calculator?

A Financial Ratio Calculator is a structured analytical document that takes figures directly from a company's balance sheet and income statement and computes standardized ratios across four categories: liquidity, profitability, leverage, and efficiency. Each ratio is presented alongside the formula used, the calculated result, and an industry benchmark, giving lenders, investors, and management a single reference document for assessing financial health. Unlike a raw set of financial statements, the calculator translates accounting figures into comparable metrics that can be tracked over time, tested against loan covenants, and benchmarked against sector peers. This template is a free Word download you can complete with your own financial data, then export as a certified PDF for submission to a bank, inclusion in a due diligence package, or internal board reporting.

Why You Need This Document

Without a completed financial ratio analysis, loan applications stall because underwriters cannot quickly assess debt service capacity; investor due diligence drags because analysts spend time calculating metrics that should have been provided upfront; and covenant breaches go undetected until a lender calls to discuss a default. The cost of neglecting ratio tracking is concrete: a missed interest coverage covenant can trigger early repayment of a credit facility, and undisclosed leverage deterioration can kill an acquisition process days before closing. For businesses with existing bank debt, a quarterly financial ratio calculator is often a contractual obligation β€” not optional reporting. This template gives you a pre-structured, certifiable format that satisfies standard lender requirements, reduces the risk of calculation errors that misrepresent your financial position, and puts the trend analysis and benchmark comparison in front of stakeholders before they have to ask for it.

Which variant fits your situation?

If your situation is…Use this template
Preparing a full investor-ready financial analysis packageFinancial Projections β€” 12 Months
Submitting covenant compliance data to a lender quarterlyFinancial Ratio Calculator (Covenant Report)
Conducting a high-level one-page financial health snapshotFinancial Health Scorecard
Analyzing a target company before acquisitionDue Diligence Checklist
Tracking monthly cash position and burn rate onlyCash Flow Statement
Presenting financial performance to a board of directorsBoard of Directors Report
Preparing a complete set of financial statements for year-end reviewAnnual Report Template

Common mistakes to avoid

❌ Using ending inventory instead of average inventory

Why it matters: Inventory balances spike at period-end for seasonal businesses, making the turnover ratio appear artificially low and misrepresenting operating efficiency to lenders.

Fix: Always use the average of opening and closing inventory. If monthly data is available, use a 13-point average (beginning of each month) for even greater accuracy.

❌ Including prepaid expenses in the quick ratio

Why it matters: Prepaid items such as insurance and rent deposits cannot be converted to cash, so including them overstates the company's ability to meet immediate obligations.

Fix: Subtract prepaid expenses and any other non-liquid current assets from the numerator before dividing by current liabilities.

❌ Presenting adjusted EBITDA as standard EBITDA without disclosure

Why it matters: Adding back restructuring costs, one-time legal settlements, or non-cash charges without labeling the result 'Adjusted EBITDA' can mislead lenders and constitutes a potential misrepresentation under most loan agreements.

Fix: Label all add-backs explicitly, list each adjustment in a footnote, and present both reported and adjusted EBITDA in the ratio table.

❌ Applying a wrong-sector benchmark

Why it matters: A 3.0x current ratio looks strong for a manufacturer but signals excess idle cash for a SaaS business; using the wrong benchmark produces a false-positive or false-negative status rating.

Fix: Source benchmarks from an industry-specific database (RMA, IBISWorld, or a sector trade association) and note the source and reference year in the template.

❌ Having the wrong person sign the certification block

Why it matters: Many loan agreements require a principal officer β€” typically the CFO or CEO β€” to certify covenant compliance. A bookkeeper or controller signature may constitute a technical default.

Fix: Review the compliance certificate requirements in the loan agreement before finalizing the document, and confirm the required title of the signing officer.

❌ Omitting the purpose-limitation disclaimer

Why it matters: Without a scope restriction, a financial ratio report can be relied upon by third parties for unintended purposes β€” potential purchasers, suppliers extending credit β€” creating liability for the preparer.

Fix: Include a standard disclaimer naming the specific purpose (e.g., 'prepared solely for submission to [LENDER] under the Loan Agreement dated [DATE]') and restrict reliance by unnamed third parties.

The 10 key clauses, explained

Reporting period and financial statement basis

In plain language: Identifies the fiscal period covered (monthly, quarterly, or annual) and specifies whether the underlying financials are audited, reviewed, or internally prepared.

Sample language
This Financial Ratio Analysis covers the period ending [DATE]. The underlying financial statements are [AUDITED / REVIEWED / INTERNALLY PREPARED] and have been prepared in accordance with [GAAP / IFRS / ASPE].

Common mistake: Omitting whether statements are audited or internally prepared. Lenders treat unaudited figures differently, and an undisclosed basis can void covenant compliance submissions.

Liquidity ratios section

In plain language: Calculates the current ratio and quick ratio from the balance sheet, with input cells for current assets, inventory, and current liabilities.

Sample language
Current Ratio: [CURRENT ASSETS] Γ· [CURRENT LIABILITIES] = [RESULT]. Quick Ratio: ([CURRENT ASSETS] βˆ’ [INVENTORY]) Γ· [CURRENT LIABILITIES] = [RESULT]. Benchmark range: Current Ratio 1.5–2.5; Quick Ratio 1.0–1.5.

Common mistake: Including prepaid expenses in the quick ratio numerator. Prepaid items cannot be converted to cash quickly and should be excluded, or the quick ratio overstates true liquidity.

Profitability ratios section

In plain language: Derives gross profit margin, net profit margin, ROA, and ROE from the income statement and balance sheet to show how efficiently the business converts revenue into profit.

Sample language
Gross Profit Margin: ([REVENUE] βˆ’ [COGS]) Γ· [REVENUE] = [RESULT]%. Net Profit Margin: [NET INCOME] Γ· [REVENUE] = [RESULT]%. ROA: [NET INCOME] Γ· [TOTAL ASSETS] = [RESULT]%.

Common mistake: Using net income before taxes for ROA and ROE. Post-tax net income is the correct input; using a pre-tax figure inflates returns and makes comparisons to published benchmarks invalid.

Leverage and solvency ratios section

In plain language: Computes debt-to-equity ratio, debt-to-assets ratio, and interest coverage ratio to indicate the degree of financial leverage and the ability to service debt.

Sample language
Debt-to-Equity: [TOTAL LIABILITIES] Γ· [SHAREHOLDERS' EQUITY] = [RESULT]. Interest Coverage (EBIT/Interest): [EBIT] Γ· [INTEREST EXPENSE] = [RESULT]x. Debt-to-Assets: [TOTAL LIABILITIES] Γ· [TOTAL ASSETS] = [RESULT].

Common mistake: Excluding off-balance-sheet obligations such as operating lease commitments from the debt figure. Post-IFRS 16 and ASC 842, most leases appear on the balance sheet β€” but legacy calculations and older templates still miss them.

Efficiency and activity ratios section

In plain language: Calculates inventory turnover, DSO, accounts payable days, and asset turnover to measure how effectively the company manages its operating cycle.

Sample language
Inventory Turnover: [COGS] Γ· [AVERAGE INVENTORY] = [RESULT]x. DSO: [ACCOUNTS RECEIVABLE] Γ· ([REVENUE] Γ· [DAYS IN PERIOD]) = [RESULT] days. AP Days: [ACCOUNTS PAYABLE] Γ· ([COGS] Γ· [DAYS IN PERIOD]) = [RESULT] days.

Common mistake: Using ending inventory instead of average inventory for the turnover calculation. Ending inventory can spike or dip at period-end, distorting the ratio; average of opening and closing inventory gives a more accurate picture.

EBITDA and cash flow ratios section

In plain language: Derives EBITDA, EBITDA margin, and the debt-to-EBITDA multiple β€” the ratios most commonly referenced in lending covenants and acquisition valuations.

Sample language
EBITDA: [EBIT] + [DEPRECIATION] + [AMORTIZATION] = [RESULT]. EBITDA Margin: [EBITDA] Γ· [REVENUE] = [RESULT]%. Debt/EBITDA: [TOTAL DEBT] Γ· [EBITDA] = [RESULT]x. Covenant threshold: ≀ [X]x.

Common mistake: Adding back non-recurring items (restructuring charges, one-time gains) without disclosing the adjustments. Adjusted EBITDA must be labeled clearly; presenting it as standard EBITDA can mislead lenders and constitute a misrepresentation.

Industry benchmark comparison table

In plain language: Lists each calculated ratio alongside the industry median and the acceptable range, allowing the reader to assess performance at a glance.

Sample language
Ratio | Calculated | Industry Median | Range | Status. Current Ratio | [X] | 2.0 | 1.5–2.5 | [WITHIN RANGE / BELOW / ABOVE]. Net Profit Margin | [X]% | [Y]% | [RANGE] | [STATUS].

Common mistake: Using generic cross-industry benchmarks when sector-specific data is available. A 5% net margin is excellent for grocery and poor for software β€” applying the wrong benchmark produces a misleading status rating.

Certification and preparer attestation

In plain language: A signed statement by the preparer β€” and, where required by a lender, by a company officer β€” confirming that the figures are accurate and drawn from the specified financial statements.

Sample language
I, [NAME], [TITLE] of [COMPANY NAME], certify that the financial ratios presented above are accurately calculated from the financial statements for the period ending [DATE] and fairly represent the financial condition of [COMPANY NAME] as of that date. Signed: ________ Date: ________

Common mistake: Having a junior bookkeeper sign the attestation when the loan agreement requires a C-level officer signature. Incorrect signatories can trigger a technical default on covenant compliance submissions.

Variance and trend analysis notes

In plain language: Optional but recommended section comparing current-period ratios to the prior period and explaining material movements of more than 10% in either direction.

Sample language
Current Ratio declined from [PRIOR] to [CURRENT] (βˆ’[X]%), primarily due to [EXPLANATION β€” e.g., drawdown of cash reserves to fund [CAPEX / ACQUISITION / SEASONAL INVENTORY BUILD]]. Management expects recovery to [TARGET] by [DATE].

Common mistake: Leaving the notes section blank when ratios have deteriorated. Lenders notice adverse trends β€” a proactive explanation with a recovery plan preserves the relationship; silence invites a compliance call.

Governing standard and disclaimer

In plain language: States the accounting standard applied, the purpose for which the calculator output may be used, and any limitations on reliance by third parties.

Sample language
This analysis has been prepared for [PURPOSE β€” e.g., internal management use / submission to [LENDER NAME] in connection with the Loan Agreement dated [DATE]] under [GAAP / IFRS]. It should not be relied upon for any other purpose without the prior written consent of [COMPANY NAME].

Common mistake: Omitting a purpose-limitation disclaimer. A financial ratio report shared without a scope restriction can be relied upon by third parties for unintended purposes, creating unexpected liability for the preparer.

How to fill it out

  1. 1

    Gather the underlying financial statements

    Collect the balance sheet and income statement for the period you are analyzing. Confirm whether they are audited, reviewed, or internally prepared, and note the accounting standard (GAAP, IFRS, or ASPE).

    πŸ’‘ Use the same-period statements throughout β€” mixing a Year-End balance sheet with a mid-year income statement produces ratios that are not comparable to any standard benchmark.

  2. 2

    Enter the reporting period and financial statement basis

    Fill in the fiscal period end date and tick the appropriate disclosure for statement quality (audited, reviewed, or internal). This information appears on every page of the output.

    πŸ’‘ If submitting to a lender, confirm their covenant reporting requirements before you start β€” some require audited statements for annual submissions and reviewed statements for quarterly ones.

  3. 3

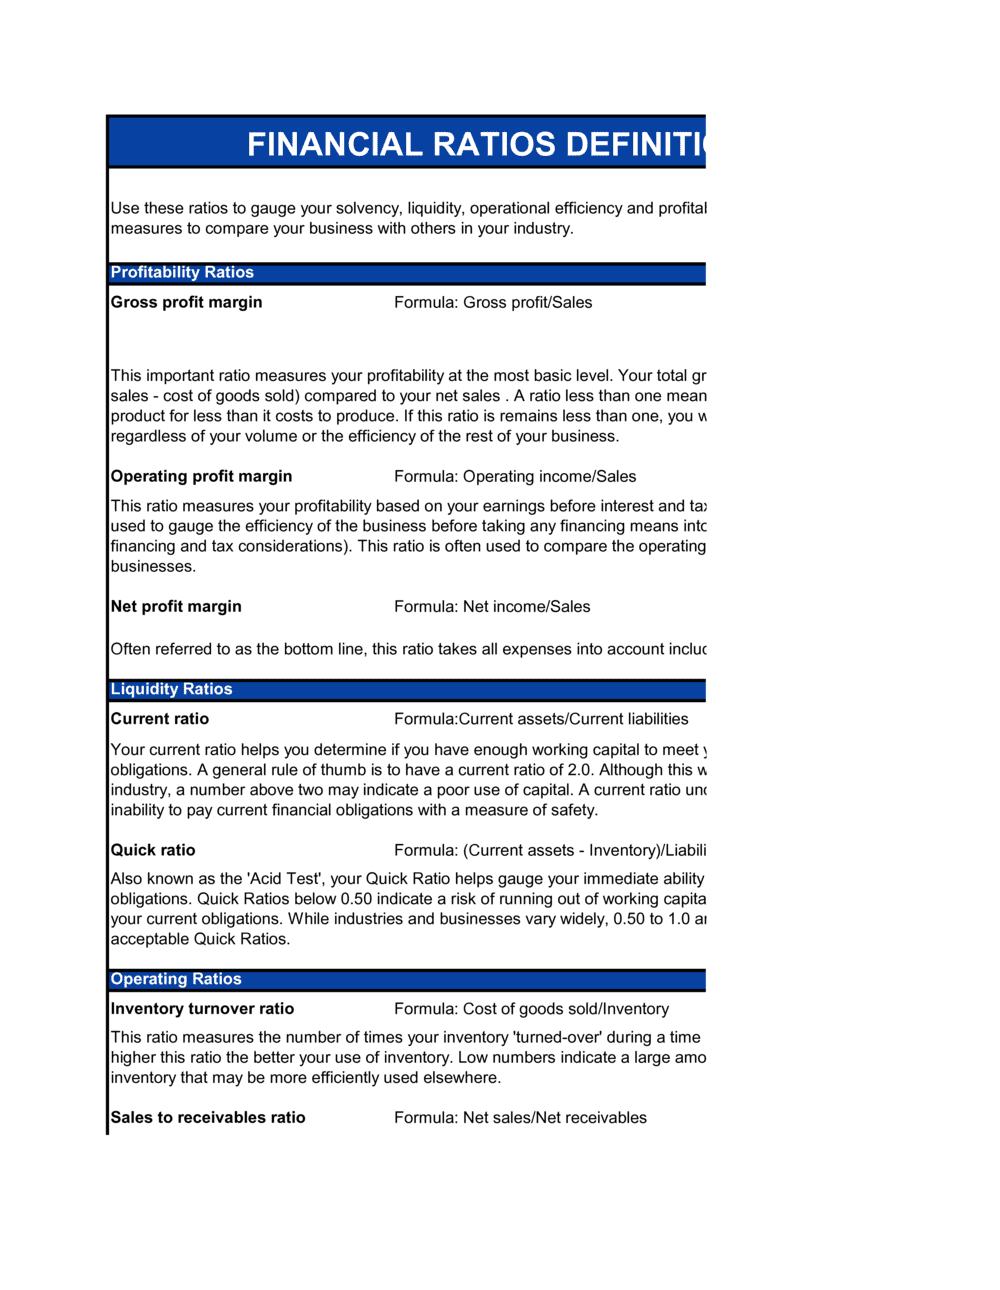
    Populate the liquidity ratios inputs

    Enter current assets, inventory, and current liabilities from the balance sheet. The template calculates current ratio and quick ratio automatically.

    πŸ’‘ Exclude prepaid expenses and deferred tax assets from the quick ratio numerator β€” these items cannot be quickly converted to cash.

  4. 4

    Complete the profitability ratios inputs

    Enter revenue, COGS, gross profit, EBIT, net income, total assets, and shareholders' equity. The template derives gross margin, net margin, ROA, and ROE.

    πŸ’‘ Use post-tax net income for ROA and ROE. Cross-check that the net income figure matches the bottom line of your income statement to the cent.

  5. 5

    Fill in the leverage and solvency inputs

    Enter total liabilities, total debt (including current portion of long-term debt), shareholders' equity, EBIT, and interest expense to compute debt-to-equity, debt-to-assets, and interest coverage.

    πŸ’‘ Check whether your loan agreement uses a narrow definition of 'total debt' (funded debt only) or a broad one (all liabilities). Use the definition in the covenant, not the balance sheet total.

  6. 6

    Enter efficiency ratio inputs

    Input COGS, average inventory (opening plus closing divided by two), accounts receivable, accounts payable, and the number of days in the period. The template calculates inventory turnover, DSO, and AP days.

    πŸ’‘ For DSO, divide accounts receivable by average daily revenue β€” not total revenue. Dividing by total revenue without adjusting for the period length produces a ratio that is not comparable across periods of different length.

  7. 7

    Review the benchmark comparison table

    Check calculated ratios against the industry benchmark column. Flag any ratio outside the acceptable range in the Status column and add a brief explanation in the variance notes section.

    πŸ’‘ Source industry benchmarks from a specific sector database (e.g., RMA Annual Statement Studies, IBISWorld, or your industry association) rather than generic business averages.

  8. 8

    Complete the certification block and obtain the required signature

    Have the appropriate officer β€” CFO, CEO, or controller, depending on the loan agreement β€” sign and date the attestation. Retain a copy with the original financial statements.

    πŸ’‘ Never pre-sign the certification before entering figures. The attestation certifies the specific numbers on the page β€” signing a blank or partially completed form exposes the signatory to personal liability.

Frequently asked questions

What is a financial ratio calculator?

A financial ratio calculator is a structured template that takes input figures from a company's balance sheet and income statement and computes standardized financial ratios across four categories: liquidity, profitability, leverage, and efficiency. The output allows lenders, investors, and management to assess financial health quickly and compare performance against industry benchmarks. It is a core component of loan applications, investor due diligence packages, and ongoing covenant compliance reporting.

What financial ratios should every business track?

At minimum, businesses should track current ratio and quick ratio for liquidity, gross margin and net margin for profitability, debt-to-equity and interest coverage for leverage, and DSO and inventory turnover for efficiency. For businesses with bank debt, debt-to-EBITDA and the interest coverage ratio are typically the ratios written into financial covenants and must be monitored at least quarterly.

What is a financial covenant and why does it matter?

A financial covenant is a binding obligation in a loan agreement requiring the borrower to maintain specific financial ratios β€” for example, keeping debt-to-EBITDA below 3.0x or maintaining an interest coverage ratio above 2.0x. Breaching a covenant gives the lender the right to accelerate repayment or impose additional fees. Regular ratio tracking using a financial ratio calculator helps borrowers identify covenant risk before it becomes a default.

How often should a business calculate its financial ratios?

Monthly tracking is best practice for management use β€” it catches deteriorating trends early enough to act. Lenders typically require quarterly or annual covenant compliance certificates. Businesses preparing for a capital raise or acquisition should calculate ratios from at least three years of historical statements to demonstrate trend stability to investors.

What is the difference between a current ratio and a quick ratio?

Both measure short-term liquidity, but the quick ratio is more conservative. The current ratio divides all current assets by current liabilities. The quick ratio removes inventory β€” and sometimes prepaid expenses β€” from the numerator, leaving only cash, short-term investments, and receivables. The quick ratio is the more relevant measure for businesses whose inventory is slow-moving or hard to liquidate quickly, such as manufacturers and distributors.

What is a good debt-to-equity ratio?

Acceptable ranges vary by industry. Capital-intensive sectors like manufacturing and real estate commonly operate with debt-to-equity ratios above 2.0x because they finance large asset bases with debt. Asset-light businesses like software companies typically target ratios below 1.0x. Most commercial lenders prefer borrowers below 2.5x; ratios above 4.0x typically require covenant waivers or additional collateral. Always compare to industry-specific benchmarks rather than a universal number.

Do I need an accountant to complete a financial ratio calculator?

For straightforward businesses with clean, internally prepared financial statements, a well-designed template is typically sufficient. Engage an accountant when the financial statements are complex (multi-entity consolidations, foreign currency translation), when the output will be certified and submitted to a lender, or when covenants are at risk and you need advice on presentation. A one-hour accountant review typically costs $150–$400 and is worthwhile before any lender submission.

What is EBITDA and why is it used in ratio analysis?

EBITDA β€” Earnings Before Interest, Taxes, Depreciation, and Amortization β€” is a proxy for a company's operating cash generation before capital structure and accounting method decisions. Lenders use it because it provides a consistent basis for comparing debt service capacity across companies with different tax profiles, depreciation policies, and financing structures. Debt-to-EBITDA is the most common leverage covenant in commercial lending agreements.

How this compares to alternatives

vs Financial Projections β€” 12 Months

Financial projections are forward-looking statements estimating future revenue, expenses, and cash flow. A financial ratio calculator analyzes historical or current-period actuals from completed financial statements. Projections answer where the business is going; ratio analysis answers how it performed and where it stands today. Lenders typically require both for a loan application.

vs Cash Flow Statement

A cash flow statement records all cash inflows and outflows over a period, organized into operating, investing, and financing activities. A financial ratio calculator uses cash flow figures as inputs to compute ratios like the cash coverage ratio but produces a different output β€” comparative metrics rather than a chronological record. Both documents are submitted together in most due diligence packages.

vs Balance Sheet

A balance sheet is a point-in-time snapshot of assets, liabilities, and equity β€” a source document, not an analytical one. The financial ratio calculator ingests balance sheet figures and transforms them into ratios that are comparable across time periods and against industry peers. You need a balance sheet to complete the calculator, but the calculator is what makes the balance sheet useful to a lender or investor.

vs Business Valuation Report

A business valuation report estimates the total enterprise or equity value of a company using methods such as DCF, comparable transactions, or asset-based approaches. Financial ratios β€” particularly EBITDA multiples β€” feed into valuation models as inputs, but the ratio calculator itself does not produce a value opinion. Use the ratio calculator to establish the operating metrics; use the valuation report to translate those metrics into a defensible price.

Industry-specific considerations

Banking and Financial Services

Lenders calculate borrower ratios at underwriting and require certified quarterly covenant compliance certificates for the life of the loan facility.

Manufacturing

Inventory turnover, asset turnover, and gross margin ratios are critical operating KPIs; high capital intensity means leverage ratios require close monitoring against banking covenants.

Retail and E-commerce

DSO, inventory turnover, and quick ratio are the most watched metrics; seasonal inventory build creates predictable current ratio fluctuations that must be explained to lenders.

SaaS and Technology

Gross margin percentage and EBITDA margin are the primary investor and lender metrics; traditional inventory and asset turnover ratios are less relevant and should be replaced with ARR-based metrics in the benchmarking table.

Healthcare

DSO is elevated due to insurance reimbursement cycles; debt-service coverage ratios are closely monitored by hospital lenders under bond indentures and credit facility agreements.

Professional Services

Revenue-per-employee and net profit margin are primary performance metrics; low asset intensity means leverage ratios look high relative to cross-industry benchmarks and require sector-specific context.

Jurisdictional notes

United States

US GAAP governs most privately held and publicly traded companies. ASC 842 (effective for most companies since 2022) requires operating leases to appear on the balance sheet, increasing reported debt-to-equity ratios compared to pre-2022 calculations. SBA lenders use standardized ratio thresholds; commercial banks set their own covenant levels. The FDIC's Uniform Financial Institutions Rating System uses a standard ratio framework for regulated lenders.

Canada

Publicly accountable Canadian enterprises use IFRS; private companies may use ASPE (Accounting Standards for Private Enterprises), which has different lease, revenue recognition, and financial instrument rules than IFRS. Ratios calculated under ASPE can differ materially from IFRS equivalents β€” always disclose the standard applied. The BDC and EDC have published sector-specific ratio benchmarks for Canadian SMEs that are more relevant than US-sourced data.

United Kingdom

UK-incorporated companies use UK GAAP (FRS 102) or IFRS depending on size and public interest status. IFRS 16, adopted in the UK alongside EU adoption, brought operating leases onto the balance sheet and affects leverage ratios for any business with significant property or equipment leases. The British Business Bank and UK commercial lenders typically reference interest coverage and debt-to-EBITDA as primary covenant metrics, consistent with practice in North America.

European Union

EU-listed companies and their subsidiaries use IFRS as endorsed by the EU. IFRS 16 lease accounting and IFRS 9 financial instrument classification both affect common ratios β€” particularly leverage and liquidity β€” compared to pre-2019 figures. Member states vary in their requirements for private companies; Germany's HGB and France's Plan Comptable GΓ©nΓ©ral produce different balance sheet classifications than IFRS. Cross-border ratio comparisons within the EU require care to confirm the accounting basis used.

Template vs lawyer β€” what fits your deal?

PathBest forCostTime
Use the templateBusiness owners and finance teams calculating ratios for internal management review or straightforward bank submissionsFree1–3 hours per period
Template + legal reviewBusinesses submitting covenant compliance certificates to lenders or including ratio analysis in investor due diligence packages$150–$400 (accountant review)1–2 business days
Custom draftedMulti-entity consolidations, cross-border financials under multiple accounting standards, or ratio calculations embedded in disputed earnout or covenant default proceedings$1,000–$5,000+ (CPA firm or financial advisor)1–3 weeks

Glossary

Current Ratio
Current assets divided by current liabilities β€” measures whether a business can cover its short-term obligations with assets it can convert to cash within 12 months.
Quick Ratio
Current assets minus inventory, divided by current liabilities β€” a stricter liquidity measure that excludes inventory, which may not convert to cash quickly.
Debt-to-Equity Ratio
Total liabilities divided by shareholders' equity β€” indicates how much of the business is financed by creditors versus owners.
Interest Coverage Ratio
EBIT divided by interest expense β€” shows how many times over a company can pay its interest charges from operating earnings.
Gross Profit Margin
Gross profit divided by revenue, expressed as a percentage β€” measures how much revenue remains after direct production costs.
Net Profit Margin
Net income divided by revenue, expressed as a percentage β€” the share of each dollar of revenue that becomes bottom-line profit.
Return on Assets (ROA)
Net income divided by total assets β€” measures how efficiently a company uses all of its assets to generate profit.
Return on Equity (ROE)
Net income divided by shareholders' equity β€” shows the return generated for every dollar of owner investment.
Inventory Turnover
Cost of goods sold divided by average inventory β€” indicates how many times a company sells and replaces its inventory in a period.
Days Sales Outstanding (DSO)
Accounts receivable divided by average daily revenue β€” the average number of days it takes to collect payment after a sale.
EBITDA Margin
EBITDA divided by revenue β€” a proxy for operating cash generation as a share of revenue, widely used in lending covenants and valuations.
Financial Covenant
A contractual requirement in a loan agreement that the borrower maintain specific financial ratios β€” breaching one can trigger default or accelerate repayment.

Part of your Business Operating System

This document is one of 3,000+ business & legal templates included in Business in a Box.

  • Fill-in-the-blanks β€” ready in minutes
  • 100% customizable Word document
  • Compatible with all office suites
  • Export to PDF and share electronically

Create your document in 3 simple steps.

From template to signed document β€” all inside one Business Operating System.
1
Download or open template

Access over 3,000+ business and legal templates for any business task, project or initiative.

2
Edit and fill in the blanks with AI

Customize your ready-made business document template and save it in the cloud.

3
Save, Share, Send, Sign

Share your files and folders with your team. Create a space of seamless collaboration.

Save time, save money, and create top-quality documents.

β˜…β˜…β˜…β˜…β˜…

"Fantastic value! I'm not sure how I'd do without it. It's worth its weight in gold and paid back for itself many times."

Managing Director Β· Mall Farm
Robert Whalley
Managing Director, Mall Farm Proprietary Limited
β˜…β˜…β˜…β˜…β˜…

"I have been using Business in a Box for years. It has been the most useful source of templates I have encountered. I recommend it to anyone."

Business Owner Β· 4+ years
Dr Michael John Freestone
Business Owner
β˜…β˜…β˜…β˜…β˜…

"It has been a life saver so many times I have lost count. Business in a Box has saved me so much time and as you know, time is money."

Owner Β· Upstate Web
David G. Moore Jr.
Owner, Upstate Web

Run your business with a system β€” not scattered tools

Stop downloading documents. Start operating with clarity. Business in a Box gives you the Business Operating System used by over 250,000 companies worldwide to structure, run, and grow their business.

Start freeΒ Β·Β No credit card required