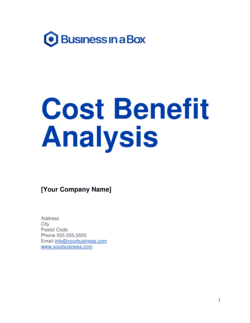
Cost Benefit Analysis Worksheet

Free Excel download β€’ Use online β€’ Print or share

4 pagesβ€’25–30 min to useβ€’Difficulty: Standard
Learn more ↓
FreeXLSCost Benefit Analysis Worksheet Template

At a glance

What it is
A Cost Benefit Analysis Worksheet is a structured decision-support document that lists all anticipated costs and quantified benefits of a proposed project, investment, or operational change side by side so decision-makers can evaluate whether the expected return justifies the expenditure. This free Word download gives you a ready-to-edit framework you can complete in a single sitting and export as PDF for presentations, proposals, or board approvals.
When you need it
Use it before committing budget to a new project, technology purchase, staffing expansion, or process change β€” any decision where you need to demonstrate that expected returns outweigh identified costs. It is also required when submitting capital expenditure requests or justifying spending to stakeholders who need documented rationale.
What's inside
Project description and decision context, a full cost inventory broken into one-time and recurring categories, a quantified benefits register, net benefit and benefit-cost ratio calculations, a break-even timeline, a risk and assumption log, and a recommendation summary that translates the numbers into a clear go or no-go position.

What is a Cost Benefit Analysis Worksheet?

A Cost Benefit Analysis Worksheet is a structured decision-support document that places every anticipated cost of a proposed project, investment, or operational change on one side of the ledger and every quantified benefit on the other, then calculates the net benefit, benefit-cost ratio (BCR), and payback period to give decision-makers a clear financial basis for approval or rejection. Unlike a rough back-of-envelope estimate, a properly completed worksheet documents the source and calculation methodology behind every figure, models a downside sensitivity scenario, and closes with an explicit recommendation β€” making the decision process auditable and defensible.

Why You Need This Document

Without a structured cost benefit analysis, spending decisions get made on advocacy rather than evidence β€” the loudest voice in the room wins, and costs that were never written down surface as budget overruns six months later. A completed worksheet forces every material cost, including transition, training, and opportunity costs that are routinely omitted from informal estimates, into the open before a single dollar is committed. It also protects you when a project underperforms: documented assumptions and a signed-off BCR show that the decision was sound given the information available at the time. This template gives you the framework to complete that analysis in a single working session, in a format that finance teams, boards, and executive sponsors already recognize and trust.

Which variant fits your situation?

If your situation is…Use this template
Evaluating a capital equipment purchaseCapital Expenditure Request
Comparing two or more competing project proposalsProject Proposal Template
Analyzing a new hire against outsourcing the same functionCost Benefit Analysis Worksheet
Forecasting multi-year financial returns on a strategic initiativeFinancial Projections Template
Presenting a business case for executive or board approvalBusiness Case Template
Evaluating a software or technology platform investmentIT Project Business Case
Quick internal check on a low-stakes operational decisionOne-Page Business Plan

Common mistakes to avoid

❌ Omitting transition and change-management costs

Why it matters: Implementation costs routinely run 20–40% higher than the direct project costs when training, process redesign, and temporary productivity loss are excluded. This produces an optimistic BCR that does not survive first-year actuals.

Fix: Add explicit line items for staff training time (hours Γ— fully loaded rate), process documentation, and a 3–6 month productivity dip during rollout.

❌ Assuming full benefits begin on day one

Why it matters: Most projects take 3–6 months to reach projected benefit levels due to adoption ramp, learning curves, and integration work. Front-loading benefits compresses the payback timeline and inflates the BCR.

Fix: Apply a ramp factor to the benefit schedule β€” for example, 25% of projected benefits in Month 1–3, 60% in Month 4–6, and 100% from Month 7 onward.

❌ Double-counting benefits under different labels

Why it matters: Listing 'reduced overtime' and 'lower labor costs' as separate line items when they measure the same hours inflates the benefit total and is immediately visible to a finance reviewer.

Fix: Trace each benefit line item to a specific current-state cost driver. If two lines reference the same cost pool, consolidate them into one.

❌ Choosing a time horizon that flatters the investment

Why it matters: Extending the analysis period from 3 to 7 years to push a marginal project into positive BCR territory is a common manipulation that experienced reviewers recognize instantly.

Fix: Set the time horizon to match the realistic useful life of the investment and document the rationale. If the investment only breaks even in Year 6 of a 5-year asset life, the BCR is effectively negative.

❌ Writing a non-committal recommendation

Why it matters: A conclusion that says 'additional analysis may be beneficial before proceeding' after 10 pages of data wastes every stakeholder's time and signals the analyst does not stand behind their own numbers.

Fix: State a clear go, no-go, or conditional recommendation in the first sentence of the summary, supported by the BCR and the single most material risk factor.

❌ Excluding opportunity cost from the cost inventory

Why it matters: When a team allocates 20% of its capacity to a new initiative, the value of the work they cannot do during that period is a real cost. Ignoring it overstates the net benefit.

Fix: Estimate the value of the next-best use of the resources committed to the project and include it as an explicit opportunity cost line item with a brief methodology note.

The 10 key sections, explained

Project description and decision context

Cost inventory β€” one-time costs

Cost inventory β€” recurring costs

Benefits register β€” tangible benefits

Benefits register β€” intangible benefits

Net benefit and benefit-cost ratio calculation

Break-even and payback timeline

Assumptions and risk log

Sensitivity analysis

Recommendation summary

How to fill it out

  1. 1

    Define the decision and set the analysis period

    Write a one-paragraph neutral description of what is being evaluated and set the time horizon for the analysis β€” typically 1, 3, or 5 years depending on the expected life of the investment.

    πŸ’‘ Match the analysis period to the useful life of the investment, not the budget cycle. A 5-year software platform warrants a 3–5 year horizon; a 12-month campaign does not.

  2. 2

    List every one-time cost with a source

    Gather vendor quotes, internal time estimates, and IT assessments to build a complete one-time cost inventory. Document the source of each figure in a note column.

    πŸ’‘ Add a 10–15% contingency line explicitly β€” embedding contingency invisibly inside other line items makes your cost estimate look inflated when reviewers spot it.

  3. 3

    List all recurring costs on an annual basis

    Convert monthly figures to annual equivalents so all recurring costs are on the same timeline as your benefits. Include incremental headcount at fully loaded cost, not base salary alone.

    πŸ’‘ Fully loaded labor cost is typically 1.25–1.35Γ— base salary once benefits, payroll taxes, and overhead are included.

  4. 4

    Quantify tangible benefits with explicit calculations

    For each benefit, write out the calculation formula β€” hours saved Γ— hourly rate, error rate reduction Γ— rework cost β€” so reviewers can verify or challenge the assumptions independently.

    πŸ’‘ Use conservative estimates for benefits and reference actual current-state data (e.g., last year's overtime spend) rather than hypothetical baselines.

  5. 5

    Document intangible benefits separately

    List qualitative benefits in their own section with a one-sentence rationale for each. Do not assign dollar values unless you have a defensible methodology.

    πŸ’‘ Tying intangibles to a measurable proxy (e.g., 'employee satisfaction β€” current score 6.2/10, industry benchmark 7.5') makes them more credible without fabricating a dollar figure.

  6. 6

    Calculate BCR, net benefit, and payback period

    Sum your 3-year (or chosen period) benefits and costs, divide to get the BCR, and subtract to get net benefit. Build a month-by-month cumulative table to identify the break-even point.

    πŸ’‘ If your BCR is between 1.0 and 1.3, the margin is thin β€” a small cost overrun or benefit shortfall flips the analysis negative. Flag this explicitly.

  7. 7

    Run a downside sensitivity test

    Model what happens if benefits come in at 70% of projection and costs run 20% over budget simultaneously. If the BCR still exceeds 1.0, the decision is robust. If it falls below 1.0, note the conditions that would trigger a project pause.

    πŸ’‘ Present the sensitivity table before the recommendation β€” it signals analytical rigor and pre-empts the most common reviewer challenge.

  8. 8

    Write a clear go or no-go recommendation

    State your recommendation in the first sentence, supported by the BCR and payback period. Identify the single most material risk and the proposed next action with an owner and date.

    πŸ’‘ Decision-makers read the recommendation first. If it is vague, they discount the entire analysis. Be direct: 'This analysis recommends approval' or 'This analysis recommends deferral pending X.'

Frequently asked questions

What is a cost benefit analysis worksheet?

A cost benefit analysis worksheet is a structured document that lists all anticipated costs and quantified benefits of a proposed project or decision side by side, then calculates the net benefit, benefit-cost ratio, and payback period. It gives decision-makers a documented, data-backed basis for approving, deferring, or rejecting a proposed investment.

When should I use a cost benefit analysis?

Use one before committing budget to any project, technology purchase, staffing change, or process improvement where the outcome is uncertain and the cost is material. It is standard practice for capital expenditure requests, vendor selection decisions, and any proposal that requires sign-off from a budget authority or board.

How do I calculate the benefit-cost ratio?

Divide your total quantified benefits for the analysis period by your total costs for the same period. A ratio above 1.0 means benefits exceed costs. For example, $450,000 in benefits divided by $300,000 in costs gives a BCR of 1.5 β€” meaning every dollar spent returns $1.50. Use the same time horizon for both sides of the calculation.

What is the difference between a cost benefit analysis and an ROI calculation?

An ROI calculation expresses net return as a percentage of the investment cost: (Benefits - Costs) / Costs Γ— 100. A cost benefit analysis is broader β€” it includes a BCR, payback timeline, sensitivity analysis, risk log, and recommendation. ROI is a single number; a cost benefit analysis is the full analytical framework that supports a decision.

Should intangible benefits be included in a cost benefit analysis?

Yes, but in a separate section without fabricated dollar values. Document each intangible benefit with a measurable proxy where possible β€” for example, an expected improvement in a customer satisfaction score or a reduction in compliance incident frequency. Reviewers discount intangibles when the tangible BCR is weak, so never rely on them to flip a marginal analysis into a positive one.

How far into the future should a cost benefit analysis project?

Match the time horizon to the realistic useful life of the investment. Software platforms typically warrant 3–5 years; physical equipment 5–10 years; hiring decisions 1–3 years. Avoid extending the horizon simply to improve a marginal BCR β€” experienced reviewers notice when the payback only materializes in Year 7 of a 5-year asset.

What discount rate should I use for NPV calculations?

Use your organization's weighted average cost of capital (WACC) if known, or a hurdle rate set by finance β€” commonly 8–12% for most businesses. For public sector or nonprofit projects, a social discount rate of 3–7% is typical. If you are unsure, present the NPV at two discount rates (e.g., 5% and 10%) so decision-makers can see the sensitivity.

Can I use this worksheet for a hiring decision?

Yes. A hiring cost benefit analysis compares the total cost of a new employee β€” salary, benefits, onboarding, equipment, management overhead β€” against the quantified value they are expected to generate, whether through revenue, cost savings, or capacity freed up elsewhere. The same BCR and payback logic applies.

What makes a cost benefit analysis credible to a finance team?

Three things: every cost and benefit line item has a documented source or calculation methodology, the time horizons are consistent across costs and benefits, and the sensitivity analysis tests a realistic downside scenario rather than only the base case. Finance reviewers immediately check whether the BCR holds when benefits are reduced by 20–30%.

How this compares to alternatives

vs Business Case Template

A business case is a broader document that includes strategic rationale, stakeholder analysis, options appraisal, and an implementation plan alongside the financial analysis. A cost benefit analysis worksheet focuses specifically on quantifying costs versus benefits and producing a BCR. Use the worksheet when you need a quick financial decision tool; use the full business case when seeking formal executive or board approval.

vs Financial Projections Template

A financial projections template models future revenue, expenses, and cash flow for an ongoing business. A cost benefit analysis evaluates a specific proposed decision β€” a project, purchase, or change β€” against the status quo. Projections describe where the business is headed; a CBA decides whether a specific action is worth taking to get there faster.

vs Project Proposal Template

A project proposal describes what will be done, by whom, and on what timeline. A cost benefit analysis answers whether it should be done by comparing expected financial return to full cost. Most capital projects require both: the CBA justifies the decision, and the proposal governs execution once approved.

vs SWOT Analysis Template

A SWOT analysis maps strengths, weaknesses, opportunities, and threats at a strategic level β€” qualitative and broad. A cost benefit analysis is quantitative and decision-specific. Use SWOT to identify whether an opportunity is worth exploring; use a CBA to determine whether the numbers support acting on it.

Industry-specific considerations

Technology / SaaS

Used to justify platform migrations, new software licenses, and infrastructure upgrades by comparing total cost of ownership against productivity and error-reduction gains.

Healthcare

Required for medical equipment purchases, EHR implementations, and staffing model changes, often with a compliance cost-avoidance component as a key benefit line item.

Manufacturing

Applied to capital equipment investments, automation initiatives, and supplier changes, with benefits modeled against throughput rates, defect rates, and downtime reduction.

Government and Public Sector

Mandated for many spending decisions and grant applications, with intangible social benefits quantified using shadow pricing methods and a social discount rate.

Professional Services

Used to evaluate technology investments, office expansions, and new service line launches, with benefits tied to billable utilization rate improvements and client retention.

Retail / E-commerce

Applied to logistics investments, platform re-platforming decisions, and marketing technology purchases, with benefits modeled against average order value lift and fulfillment cost per unit.

Template vs pro β€” what fits your needs?

PathBest forCostTime
Use the templateProject managers, operations leads, and small business owners evaluating decisions under $250KFree2–4 hours
Template + professional reviewDecisions involving significant capital expenditure or requiring CFO or board sign-off$200–$800 for a finance manager or external analyst review1–3 days
Custom draftedPublic sector projects, regulated industries, or investments above $1M requiring independent economic analysis$2,000–$15,000 for a management consultant or economist2–6 weeks

Glossary

Benefit-Cost Ratio (BCR)
Total quantified benefits divided by total costs β€” a ratio above 1.0 indicates the project returns more than it costs.
Net Present Value (NPV)
The current value of all future cash benefits minus the current value of all costs, adjusted for the time value of money using a discount rate.
Break-Even Point
The point in time at which cumulative benefits equal cumulative costs β€” after this point the project generates net positive return.
Discount Rate
The annual percentage used to reduce future cash flows to their present value, reflecting the opportunity cost of capital or a target return threshold.
Tangible Benefit
A benefit that can be directly measured in dollar terms, such as reduced labor hours, lower material costs, or increased revenue.
Intangible Benefit
A benefit that is real but difficult to assign a precise monetary value to, such as improved employee morale, brand reputation, or regulatory goodwill.
Opportunity Cost
The value of the next-best alternative foregone by choosing a particular course of action β€” a cost that does not appear on any invoice but still belongs in the analysis.
Sensitivity Analysis
A test that shows how the net benefit or BCR changes when key assumptions β€” such as adoption rate, price, or timeline β€” are adjusted by a defined percentage.
Sunk Cost
Money already spent that cannot be recovered β€” sunk costs should be excluded from a forward-looking cost benefit analysis because they do not affect the decision at hand.
Payback Period
The number of months or years required for cumulative benefits to fully recover the initial investment, calculated without discounting future cash flows.

Part of your Business Operating System

This document is one of 3,000+ business & legal templates included in Business in a Box.

  • Fill-in-the-blanks β€” ready in minutes
  • 100% customizable Word document
  • Compatible with all office suites
  • Export to PDF and share electronically

Create your document in 3 simple steps.

From template to signed document β€” all inside one Business Operating System.
1
Download or open template

Access over 3,000+ business and legal templates for any business task, project or initiative.

2
Edit and fill in the blanks with AI

Customize your ready-made business document template and save it in the cloud.

3
Save, Share, Send, Sign

Share your files and folders with your team. Create a space of seamless collaboration.

Save time, save money, and create top-quality documents.

β˜…β˜…β˜…β˜…β˜…

"Fantastic value! I'm not sure how I'd do without it. It's worth its weight in gold and paid back for itself many times."

Managing Director Β· Mall Farm
Robert Whalley
Managing Director, Mall Farm Proprietary Limited
β˜…β˜…β˜…β˜…β˜…

"I have been using Business in a Box for years. It has been the most useful source of templates I have encountered. I recommend it to anyone."

Business Owner Β· 4+ years
Dr Michael John Freestone
Business Owner
β˜…β˜…β˜…β˜…β˜…

"It has been a life saver so many times I have lost count. Business in a Box has saved me so much time and as you know, time is money."

Owner Β· Upstate Web
David G. Moore Jr.
Owner, Upstate Web

Run your business with a system β€” not scattered tools

Stop downloading documents. Start operating with clarity. Business in a Box gives you the Business Operating System used by over 250,000 companies worldwide to structure, run, and grow their business.

Free Forever PlanΒ Β·Β No credit card required