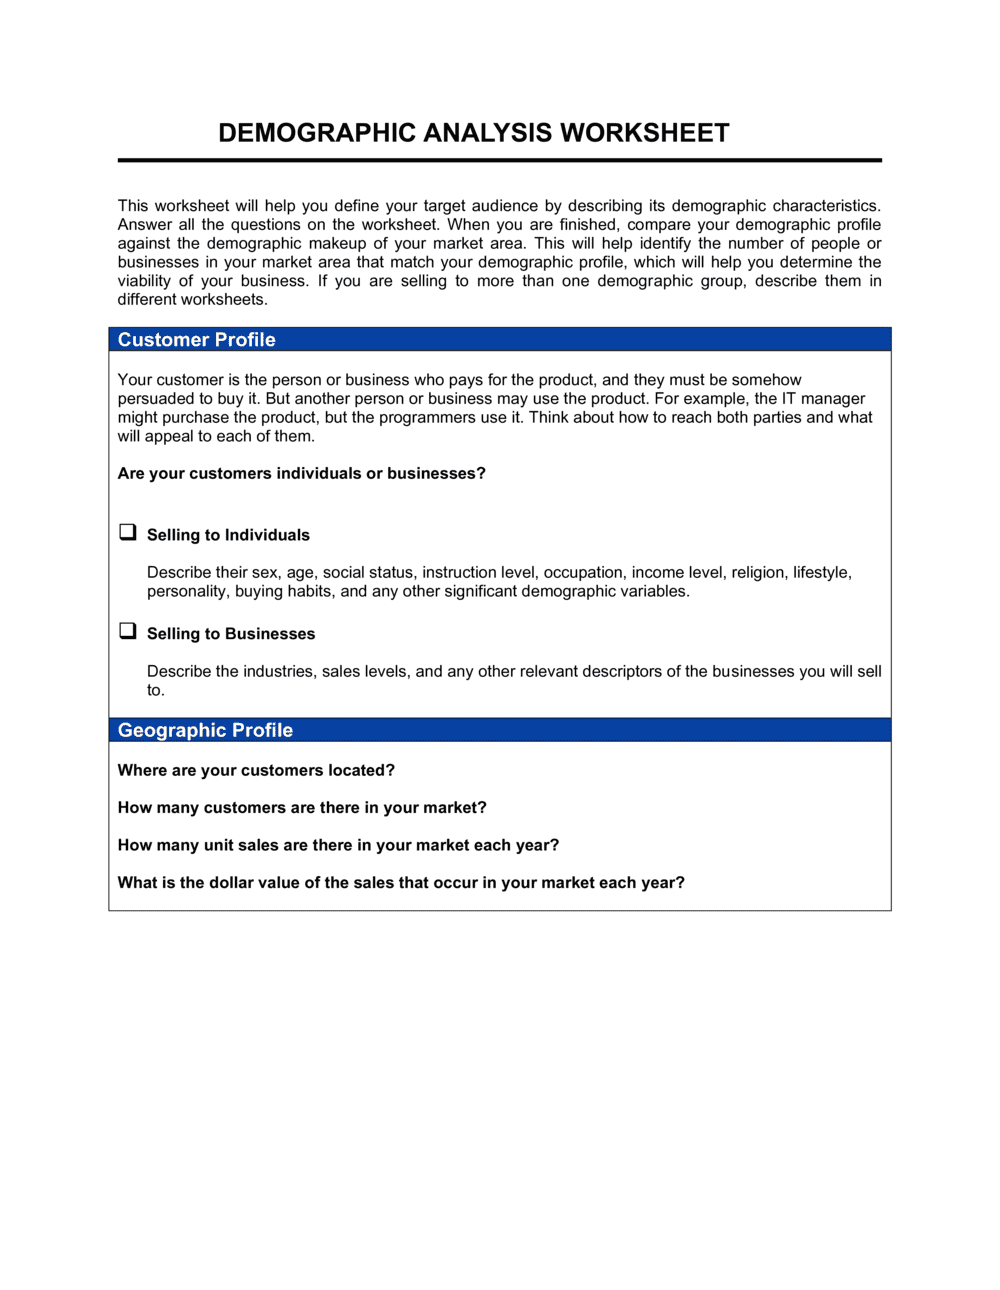
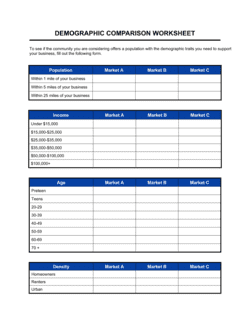
Worksheet_Demographic Analysis

Free download β€’ Use as a template β€’ Print or share

1 pageβ€’20–25 min to useβ€’Difficulty: Standard
Learn more ↓
FreeWorksheet_Demographic Analysis Template

At a glance

What it is
A Demographic Analysis Worksheet is a structured operational document used to collect, organize, and interpret population or customer data β€” including age, gender, income, education, location, and occupation β€” to define and profile a specific target segment. This free Word download gives you a ready-to-use framework you can edit online and export as PDF to support marketing, product, and strategic planning decisions.
When you need it
Use it when entering a new market, launching a product or service, designing a marketing campaign, or refreshing your understanding of who your current and prospective customers actually are. It is also valuable when preparing a business plan or presenting segment analysis to stakeholders or investors.
What's inside
Sections covering the scope and purpose of the analysis, primary and secondary demographic variables, data sources, segment profiles, key findings, and strategic implications. Each section prompts you to record specific data points and draw actionable conclusions.

What is a Demographic Analysis Worksheet?

A Demographic Analysis Worksheet is a structured operational document that guides analysts, marketers, and planners through the systematic collection and interpretation of population data β€” including age, income, education, geographic distribution, household structure, and employment status β€” to define and profile a specific target market or customer segment. Unlike a freeform research note, the worksheet enforces a consistent analytical sequence: scope definition, data sourcing, variable recording, segment profiling, findings interpretation, and strategic recommendations. The result is a reusable, auditable document that connects raw data to concrete business decisions.

Why You Need This Document

Without a structured framework, demographic research tends to accumulate disconnected statistics that never translate into actionable decisions. Marketing campaigns get aimed at poorly defined audiences, new locations get selected on intuition rather than income and household data, and product pricing gets set without reference to what the target segment can actually afford. A completed demographic analysis worksheet eliminates these gaps by forcing you to name the decision being made before any data is collected β€” and by requiring every finding to connect to a specific implication. For teams preparing a business plan, investor pitch, or marketing strategy, it also provides documented, citable evidence that the target segment exists, is reachable, and is large enough to justify the investment.

Which variant fits your situation?

If your situation is…Use this template
Analyzing customer segments for a B2C product launchCustomer Demographic Analysis Worksheet
Sizing a market for a business plan or investor pitchMarket Analysis Template
Building detailed psychographic and behavioral profilesCustomer Persona Template
Assessing workforce composition for HR planningWorkforce Planning Template
Evaluating geographic market potential by locationMarket Segmentation Analysis
Summarizing demographic findings for a business planBusiness Plan Template
Presenting segment data to executives or board membersMarket Research Report

Common mistakes to avoid

❌ Reporting averages without distributions

Why it matters: A single median age or income figure hides the spread within a segment. A segment with median income $65,000 that ranges from $20,000 to $200,000 requires entirely different pricing and messaging than one clustered between $55,000 and $75,000.

Fix: Always report ranges, deciles, or percentage breakdowns alongside any mean or median. A simple histogram table in the core variables section solves this in minutes.

❌ Using outdated secondary data without flagging it

Why it matters: Demographics shift faster than most analysts assume β€” especially in high-growth metros, post-pandemic migration markets, and segments defined by age cohorts. A 2019 income profile can be structurally wrong by 2026.

Fix: Record the publication date of every secondary source and note any sources older than three years as requiring verification. Supplement with more recent proprietary or primary data where possible.

❌ Creating too many micro-segments

Why it matters: Five or six sub-segments with 3–8% population share each cannot be targeted cost-effectively. The analysis looks thorough but produces no actionable direction.

Fix: Consolidate to two to four primary segments. If a sub-group is too small for standalone targeting, note it as a secondary consideration rather than a core segment.

❌ Writing findings without strategic interpretation

Why it matters: A findings section that reads as a list of statistics β€” 'median age is 38,' 'income is $72,000' β€” forces readers to do the interpretive work themselves, which means the analysis gets ignored.

Fix: For every data point in the findings section, add one sentence explaining what it means for the decision the analysis is supporting. If you cannot connect the data to a decision, remove it.

❌ Omitting data limitations

Why it matters: An analysis that presents findings with no caveats looks authoritative until a stakeholder finds the gap, at which point all conclusions are questioned β€” including the valid ones.

Fix: Include a dedicated limitations section that names each gap, rates its impact on the conclusions, and suggests how it could be addressed in a follow-up effort.

❌ Scoping the analysis too broadly

Why it matters: 'All adults in the United States' is not an analyzable segment β€” it produces averages that describe no one specifically and recommendations that are too general to act on.

Fix: Constrain the scope to the population directly relevant to the decision: a specific geography, a defined age cohort, or an existing customer base. Narrow scope produces sharper, more usable findings.

The 9 key sections, explained

Analysis scope and objective

Data sources

Core demographic variables

Geographic distribution

Household and family structure

Segment profiles

Key findings and trends

Gaps and data limitations

Strategic implications and recommendations

How to fill it out

  1. 1

    Define the scope and decision being supported

    Name the specific population, geography, and time period you are analyzing. State the one or two business decisions this analysis will directly inform β€” product pricing, channel selection, market entry, or campaign targeting.

    πŸ’‘ Write the decision statement before collecting any data. It prevents scope creep and keeps every section focused on data that actually matters.

  2. 2

    Identify and document your data sources

    List all primary and secondary sources with publication dates, sample sizes, and geographic coverage. For US markets, start with the Census Bureau's American Community Survey and layer in any proprietary customer data you hold.

    πŸ’‘ Flag any source older than three years with a note β€” demographic distributions shift meaningfully over short periods in high-growth metros and industries.

  3. 3

    Record core demographic variables

    Enter age distribution (by range, not just median), gender breakdown, income distribution, education levels, and employment status. Pull ranges and percentiles, not just averages, for every continuous variable.

    πŸ’‘ Income distribution is often bimodal in mixed urban-suburban segments β€” report it as a histogram range, not a single median number.

  4. 4

    Map geographic concentration

    Identify the top geographic clusters where your target population is concentrated. Note urban, suburban, and rural splits and flag any regional variations in key variables like income or education.

    πŸ’‘ Use Census Bureau ZIP Code Tabulation Area (ZCTA) data for free, granular geographic breakdowns available at no cost.

  5. 5

    Build segment profiles

    Group the population into two to four distinct sub-segments based on the variables most relevant to your decision. Label each segment descriptively and record its share of the total population.

    πŸ’‘ Fewer, larger segments are more actionable than many small ones. Aim for segments that are each large enough to justify a separate channel or message.

  6. 6

    Write key findings with interpretations

    For each major pattern in the data, write one sentence describing what the data shows and one sentence explaining what it means for the decision at hand. Avoid listing numbers without commentary.

    πŸ’‘ If a finding does not change a decision, cut it. The findings section should contain only insights that alter strategy.

  7. 7

    Document data gaps and limitations

    List any variables you could not measure, any sources that may be outdated, and any groups that may be underrepresented in the data. Rate each limitation as low, medium, or high impact on the conclusions.

    πŸ’‘ Documenting limitations proactively builds credibility with stakeholders β€” it signals analytical rigor rather than weakness.

  8. 8

    State specific strategic implications

    Translate each key finding into a concrete, decision-ready recommendation. Reference the specific data point that supports it and the action it recommends β€” channel, price, geography, or product feature.

    πŸ’‘ Each implication should name a responsible owner and a decision deadline so the analysis generates action, not a file in a shared drive.

Frequently asked questions

What is a demographic analysis worksheet?

A demographic analysis worksheet is a structured document that guides you through collecting, organizing, and interpreting population or customer data β€” including age, income, education, location, and household structure β€” to profile a specific market segment. It turns raw data from census records, surveys, and industry reports into segment descriptions and strategic recommendations your team can act on.

What data sources should I use for a demographic analysis?

For US-based analyses, the Census Bureau's American Community Survey is the most comprehensive free source β€” it covers income, education, employment, household structure, and geography down to the ZIP code level. Supplement it with your own customer records, survey results, or syndicated research from sources like Nielsen, Statista, or Pew Research. Always record the publication date of every source you use.

What demographic variables should I include?

Core variables for most analyses are age distribution, gender breakdown, household income range, education level, employment status, geographic concentration, and household size. The right mix depends on your objective β€” a retailer entering a new market weights income and location heavily, while a healthcare organization might prioritize age, household structure, and insurance coverage rates.

How is a demographic analysis different from a customer persona?

A demographic analysis documents measurable, statistical characteristics of a population using actual data β€” census records, surveys, and customer databases. A customer persona synthesizes that data into a semi-fictional profile of an ideal customer, adding behavioral and psychographic detail. The demographic analysis is the evidence base; the persona is the communication tool built from it. You typically complete the demographic analysis before creating personas.

How many segments should a demographic analysis include?

Two to four segments is the practical range for most business decisions. Fewer than two means you are not differentiating your audience at all; more than four usually produces sub-segments too small to target cost-effectively. Each segment should be large enough to justify its own channel strategy, message, or product feature β€” if it is not, merge it with the nearest adjacent group.

How often should a demographic analysis be updated?

For active marketing or product planning, update the analysis annually or whenever you enter a new market, launch a new product line, or see a significant shift in customer acquisition patterns. Demographic data from the US Census Bureau is updated annually through the American Community Survey, so an analysis built on ACS data can be refreshed cost-effectively each year without primary research.

Can I use a demographic analysis worksheet for internal HR planning?

Yes, though the variables shift. Internal workforce demographic analyses typically cover employee age distribution, tenure, education, role concentration by location, and representation by gender and ethnicity. The structure of the worksheet β€” scope, data sources, variables, segment profiles, findings, and implications β€” applies equally to workforce analysis as it does to market analysis.

What is the difference between demographics and psychographics?

Demographics are objective, measurable characteristics β€” age, income, education, location. Psychographics describe values, attitudes, interests, and lifestyle preferences, which are harder to measure and typically gathered through surveys or behavioral data. Demographic analysis provides the structural foundation; psychographic profiling adds texture. Most complete audience analyses combine both, with demographics defining the segment boundaries and psychographics explaining purchase motivations.

Do I need a data analyst to complete this worksheet?

No β€” the worksheet is designed for marketing managers, business owners, and planners who work with publicly available data. If your analysis relies on large proprietary datasets or requires statistical significance testing, a data analyst adds value. For analyses based on census data, published industry reports, and customer records with sample sizes under a few thousand, the worksheet guides you through the process without specialist tools.

How this compares to alternatives

vs Market research report

A market research report is a comprehensive, often externally produced document covering competitive landscape, customer behavior, market sizing, and trend analysis. A demographic analysis worksheet is a focused internal tool for profiling a specific population segment using available data. The worksheet feeds into a larger market research effort rather than replacing it.

vs Customer persona template

A customer persona template creates a named, semi-fictional profile of an ideal customer that humanizes demographic data for marketing and product teams. A demographic analysis worksheet is the evidence-gathering step that precedes persona creation β€” it documents the statistical foundation on which personas are built. Use the worksheet first, then the persona template.

vs SWOT analysis

A SWOT analysis evaluates internal strengths and weaknesses alongside external opportunities and threats at the organizational level. A demographic analysis is a purely external, data-driven profile of a population segment. Demographic findings often feed the 'opportunities' and 'threats' quadrants of a SWOT, but the two documents serve different analytical purposes.

vs Market segmentation analysis

A market segmentation analysis divides a total addressable market into groups using demographic, behavioral, geographic, and psychographic variables, then evaluates each segment for attractiveness and fit. A demographic analysis worksheet focuses specifically on demographic variables and is narrower in scope. The demographic worksheet is typically one input into a broader segmentation exercise.

Industry-specific considerations

Retail and e-commerce

Income distribution and geographic concentration drive store location decisions, product assortment, and digital ad targeting by ZIP code cluster.

Healthcare and wellness

Age distribution, household size, and insurance coverage rates determine service demand, facility sizing, and outreach channel selection.

Financial services

Income range, homeownership rate, and household structure define product eligibility, pricing tiers, and the right channel mix between branch, app, and advisor.

Education and nonprofits

Education attainment levels, household income, and age cohort data inform program design, scholarship eligibility criteria, and grant-writing market justification.

Real estate and property development

Household formation rates, median income, homeownership trends, and in-migration patterns determine project feasibility and unit mix decisions.

SaaS and technology

Job function, company size, and professional education level define the ICP for B2B targeting, while age and income shape freemium conversion and willingness-to-pay benchmarks for B2C products.

Template vs pro β€” what fits your needs?

PathBest forCostTime
Use the templateMarketing managers, small business owners, and planners working with publicly available census and industry dataFree4–8 hours
Template + professional reviewTeams entering a new market or making a major investment decision who want a professional review of their data interpretation$500–$2,000 for a market research consultant review1–2 weeks
Custom draftedOrganizations requiring primary research, large-scale survey design, or statistical modeling to support a high-stakes launch or funding round$5,000–$25,000+ for a full primary research engagement4–12 weeks

Glossary

Demographics
Statistical characteristics of a population β€” such as age, sex, income, education, and occupation β€” used to categorize and analyze groups of people.
Market Segment
A subset of a total market made up of people who share common demographic, behavioral, or psychographic characteristics.
Target Audience
The specific group of people most likely to buy a product or respond to a campaign, defined by a combination of demographic and behavioral attributes.
Primary Data
Information collected directly from respondents through surveys, interviews, or focus groups β€” gathered specifically for the analysis at hand.
Secondary Data
Existing data sourced from published reports, government census records, industry databases, or third-party research β€” not collected by the analyst.
Psychographics
Attributes describing a population's values, attitudes, interests, and lifestyles β€” complementary to demographics but not the same thing.
Median Household Income
The income level at which half of households in a geographic area earn more and half earn less β€” a standard variable in demographic analysis.
Customer Persona
A semi-fictional profile of an ideal customer built from demographic and behavioral data, used to humanize segments for marketing and product teams.
Census Data
Population statistics collected by a national government β€” in the US, the Census Bureau publishes free, detailed demographic data by geography.
Segmentation Variable
A specific characteristic β€” age range, education level, ZIP code β€” used to divide a population into distinct, analyzable groups.

Part of your Business Operating System

This document is one of 3,000+ business & legal templates included in Business in a Box.

  • Fill-in-the-blanks β€” ready in minutes
  • 100% customizable Word document
  • Compatible with all office suites
  • Export to PDF and share electronically

Create your document in 3 simple steps.

From template to signed document β€” all inside one Business Operating System.
1
Download or open template

Access over 3,000+ business and legal templates for any business task, project or initiative.

2
Edit and fill in the blanks with AI

Customize your ready-made business document template and save it in the cloud.

3
Save, Share, Send, Sign

Share your files and folders with your team. Create a space of seamless collaboration.

Save time, save money, and create top-quality documents.

β˜…β˜…β˜…β˜…β˜…

"Fantastic value! I'm not sure how I'd do without it. It's worth its weight in gold and paid back for itself many times."

Managing Director Β· Mall Farm
Robert Whalley
Managing Director, Mall Farm Proprietary Limited
β˜…β˜…β˜…β˜…β˜…

"I have been using Business in a Box for years. It has been the most useful source of templates I have encountered. I recommend it to anyone."

Business Owner Β· 4+ years
Dr Michael John Freestone
Business Owner
β˜…β˜…β˜…β˜…β˜…

"It has been a life saver so many times I have lost count. Business in a Box has saved me so much time and as you know, time is money."

Owner Β· Upstate Web
David G. Moore Jr.
Owner, Upstate Web

Run your business with a system β€” not scattered tools

Stop downloading documents. Start operating with clarity. Business in a Box gives you the Business Operating System used by over 250,000 companies worldwide to structure, run, and grow their business.

Start freeΒ Β·Β No credit card required