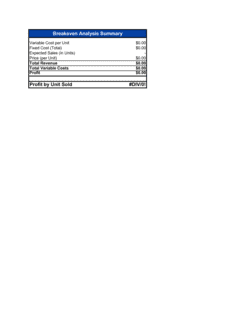
Breakeven and Profit-Volume-Cost Analysis Template

Free Excel download β€’ Use online β€’ Print or share

1 pageβ€’20–25 min to useβ€’Difficulty: Standard
Learn more ↓
FreeXLSBreakeven and Profit-Volume-Cost Analysis Template

At a glance

What it is
A Breakeven and Profit Volume Cost Analysis is a structured financial report that calculates the exact sales volume at which total revenues equal total costs β€” the breakeven point β€” and then models how profits change as volume rises or falls. This free Word download gives you a ready-to-complete template you can edit online and export as PDF to share with leadership, lenders, or investors.
When you need it
Use it when pricing a new product, evaluating a cost-structure change, preparing a budget, assessing a new business line, or presenting financial viability to a bank or investor. It is especially valuable before committing to significant fixed-cost increases such as a new lease, equipment purchase, or staffing expansion.
What's inside
Fixed and variable cost classifications, contribution margin calculation, breakeven point in units and revenue dollars, target profit volume calculations, margin of safety analysis, and a sensitivity summary showing how changes in price, volume, or cost alter profitability.

What is a Breakeven and Profit Volume Cost Analysis?

A Breakeven and Profit Volume Cost Analysis is a structured financial report that calculates the exact sales volume at which a business covers all its costs β€” fixed and variable β€” and then models how profit changes as volume rises or falls above that threshold. The analysis classifies every cost into fixed (rent, salaries, insurance) or variable (materials, commissions, shipping), derives the contribution margin each unit sale generates toward covering fixed costs, and uses that margin to identify the breakeven point in both units and revenue dollars. It then extends the model to show what sales volumes are required to hit specific profit targets, and stress-tests those results against changes in price, cost, and volume through a sensitivity analysis.

Why You Need This Document

Without a breakeven analysis, pricing and cost decisions rest on intuition rather than arithmetic. Businesses that skip it frequently set prices that feel competitive but leave contribution margins too thin to cover fixed overhead β€” a situation that only becomes visible when the monthly loss arrives. For anyone seeking a bank loan or presenting to investors, a completed CVP analysis is a standard credibility requirement: lenders use the margin of safety figure to verify that projected revenues cover debt service even in a downside scenario. Internally, the analysis gives management a concrete minimum sales target to communicate to the sales team, a quantified risk threshold that triggers contingency planning, and a tool for evaluating whether a proposed cost increase β€” a new hire, an equipment lease, a facility expansion β€” can be absorbed by realistic additional volume. This template structures the entire calculation in a single document you can complete in an afternoon with actual cost data and share with any stakeholder who needs to understand your financial floor.

Which variant fits your situation?

If your situation is…Use this template
Single-product business needing a quick breakeven calculationBreakeven Analysis (Simple)
Multi-product business needing weighted average contribution marginsMulti-Product CVP Analysis
New venture requiring full 3–5 year profit and loss projectionsFinancial Projections (12 Months)
Pricing a new product and comparing margin scenariosPricing Strategy Template
Bank loan application requiring a complete financial packageBusiness Plan (with financials)
Internal budget planning with departmental cost allocationAnnual Budget Template
Evaluating a capital investment against projected returnsCapital Expenditure Request

Common mistakes to avoid

❌ Mixing fixed and variable cost classifications

Why it matters: Misclassifying a variable cost as fixed (or vice versa) shifts the breakeven point and can make a loss-making product look viable β€” or a profitable one look risky.

Fix: For each cost line, ask: 'Does this cost change if we sell zero units next month?' If yes, it is variable. If not, it is fixed. Review the classification with an accountant if any lines are ambiguous.

❌ Using gross margin instead of contribution margin

Why it matters: Gross margin typically includes allocated fixed manufacturing overhead, which inflates the apparent per-unit contribution and produces a breakeven point that is too low.

Fix: Strip out any fixed overhead allocations from the per-unit cost figure before calculating contribution margin. Use only truly variable per-unit costs.

❌ Reporting the margin of safety only in dollars

Why it matters: A $200,000 margin of safety sounds reassuring until you realize it represents 3% of projected revenue β€” one contract cancellation away from a loss.

Fix: Always express margin of safety as both a dollar figure and a percentage of projected sales so the risk level is immediately interpretable.

❌ Running the analysis once and treating it as static

Why it matters: A breakeven model built on January assumptions is obsolete by March if costs, prices, or volumes have shifted. Decisions made on stale numbers produce predictable losses.

Fix: Update the analysis whenever a significant input changes β€” a price adjustment, a new supplier contract, a lease renewal, or a change in sales mix β€” and re-present to decision-makers.

❌ Ignoring the impact of sales mix on the breakeven point

Why it matters: A business selling multiple products at different margins will hit a different breakeven point depending on which products sell most. Assuming a fixed mix that does not reflect reality understates or overstates profitability.

Fix: For multi-product businesses, calculate a weighted average contribution margin based on the expected sales mix, and update it when the mix shifts materially.

❌ Presenting the analysis without a stated assumption set

Why it matters: Readers cannot challenge, validate, or update the model if they cannot see the inputs. An unsourced analysis is an unverifiable one.

Fix: Always include a clearly labeled assumptions section at the top of the report, listing every input with its source and the date it was last verified.

The 9 key sections, explained

Assumptions and scope

Fixed cost schedule

Variable cost schedule

Contribution margin calculation

Breakeven point in units and revenue

Target profit volume analysis

Margin of safety analysis

Sensitivity analysis

Conclusions and recommendations

How to fill it out

  1. 1

    Define the scope and analysis period

    Specify the product, product line, or business unit being analyzed and the time period the analysis covers. State whether costs are monthly, annual, or per-project.

    πŸ’‘ Analyzing one product or unit at a time produces cleaner results. Multi-product analyses require a weighted average contribution margin, which adds complexity.

  2. 2

    List and total all fixed costs

    Itemize every cost that does not change with sales volume β€” rent, fixed salaries, insurance, depreciation, loan payments, and software subscriptions. Total them for the chosen period.

    πŸ’‘ Review the last 12 months of actual P&L line by line rather than estimating from memory. Managers routinely undercount fixed costs by 10–20%.

  3. 3

    List and total all variable costs per unit

    Identify every cost that scales directly with each unit sold: materials, direct labor, commissions, packaging, and shipping. Calculate a single total variable cost per unit.

    πŸ’‘ Express commissions as a dollar amount per unit at your expected average selling price rather than as a percentage, so the contribution margin calculation stays consistent.

  4. 4

    Calculate contribution margin and the CM ratio

    Subtract total variable cost per unit from the selling price to get contribution margin per unit. Divide by selling price to get the contribution margin ratio.

    πŸ’‘ A CM ratio below 30% typically signals thin margins that leave the breakeven point highly sensitive to any cost increase or price discount.

  5. 5

    Calculate the breakeven point in units and revenue

    Divide total fixed costs by contribution margin per unit to get the unit breakeven. Multiply by selling price to convert to breakeven revenue.

    πŸ’‘ Cross-check by plugging the unit breakeven back into the P&L: (units Γ— price) βˆ’ (units Γ— variable cost) βˆ’ fixed costs should equal exactly zero.

  6. 6

    Model target profit scenarios

    Add each target profit figure to total fixed costs, then divide by contribution margin per unit to find the required sales volume for each scenario.

    πŸ’‘ Include at least three scenarios: your conservative target, your base case, and your stretch goal. This gives stakeholders a range rather than a single point estimate.

  7. 7

    Complete the margin of safety and sensitivity analysis

    Calculate margin of safety against your base-case revenue projection. Then shift selling price, variable cost, and fixed cost by Β±10% and Β±20% to generate sensitivity scenarios.

    πŸ’‘ Highlight any scenario where the margin of safety drops below 10% β€” that threshold is a standard risk flag for lenders and finance committees.

  8. 8

    Write conclusions with specific recommended actions

    Summarize the breakeven level, margin of safety, and the most critical sensitivity finding. State at least two concrete actions management should take based on the results.

    πŸ’‘ Lead with the insight that most directly affects a decision β€” pricing, cost reduction, or minimum sales targets β€” not with a restatement of the methodology.

Frequently asked questions

What is a breakeven analysis?

A breakeven analysis calculates the sales volume β€” in units or revenue dollars β€” at which total revenues exactly equal total costs, producing neither profit nor loss. It divides costs into fixed (those that do not change with volume) and variable (those that do), then uses the contribution margin per unit to determine the minimum sales level the business must reach to avoid a loss.

What is the difference between breakeven analysis and CVP analysis?

Breakeven analysis is a subset of cost-volume-profit (CVP) analysis. Breakeven analysis answers one question: how many units must be sold to cover all costs? CVP analysis is broader β€” it models how changes in selling price, variable cost, fixed cost, and sales volume interact to affect profit across a range of scenarios, including target profit calculations and sensitivity testing.

How do I calculate the breakeven point in units?

Divide total fixed costs by the contribution margin per unit. Contribution margin per unit equals selling price minus variable cost per unit. For example, if fixed costs are $50,000 per month, the selling price is $100, and variable cost per unit is $60, the contribution margin is $40 and the breakeven point is 50,000 Γ· 40 = 1,250 units per month.

What is a good margin of safety?

A margin of safety above 20% is generally considered comfortable for most businesses β€” it means sales can fall 20% before the business begins losing money. Below 10% is a warning sign that deserves management attention. Capital-intensive businesses with high fixed costs often operate with lower margins of safety and compensate with strong pricing power or long-term contracts that reduce volume uncertainty.

Can I use this analysis for a service business?

Yes. For service businesses, replace unit volume with billable hours, client engagements, or transactions. Variable costs typically include direct labor at hourly rates, subcontractor fees, and any client-specific expenses. Fixed costs cover office overhead, salaried staff, and software. The contribution margin per service unit drives the same breakeven calculation as a product business.

How is breakeven analysis used in pricing decisions?

By running the breakeven calculation at multiple price points, you can see how a price change affects the volume needed to cover costs. A 10% price increase raises the contribution margin per unit, lowering the breakeven point β€” but only if the volume loss from the price increase is smaller than the gain from the higher margin. The sensitivity analysis section of this template makes those trade-offs explicit.

What is operating leverage and why does it matter in this analysis?

Operating leverage measures how heavily a business relies on fixed costs. A high-fixed-cost business (e.g., a manufacturer or airline) has high operating leverage β€” profits grow quickly above the breakeven point but losses deepen quickly below it. A low-fixed-cost business (e.g., a staffing agency) has lower leverage and more stable, if slower, profit growth. The breakeven and CVP analysis makes operating leverage visible so management can make informed decisions about cost structure.

How often should I update the breakeven analysis?

Update it whenever a material input changes: a price increase or decrease, a new supplier contract, a lease renewal, a significant hiring decision, or a shift in sales mix. At minimum, refresh the analysis annually as part of the budget cycle. A model built on inputs from 18 months ago is more likely to mislead than guide.

Is this template suitable for a bank loan application?

A completed breakeven and CVP analysis is a standard supporting document for SBA loans and many conventional business loans. Lenders use it to verify that projected revenues cover debt service and operating costs with an adequate margin of safety. Pair it with a 12-month cash flow projection and a full business plan for a complete application package.

How this compares to alternatives

vs Financial Projections (12 Months)

A 12-month financial projection models expected revenue, expenses, and cash flow over a full year using a calendar timeline. A breakeven analysis focuses on a single question β€” what sales volume eliminates losses β€” and does not require month-by-month scheduling. Use the breakeven analysis to validate the assumptions inside a financial projection, not as a replacement for it.

vs Annual Budget Template

An annual budget allocates planned spending across departments and time periods and tracks actuals against targets. A breakeven analysis strips away the calendar structure to focus purely on the relationship between cost, volume, and profit. Budgets tell you what you plan to spend; breakeven analysis tells you what you must sell to justify that spending.

vs Business Plan

A business plan is a comprehensive document covering market analysis, strategy, operations, team, and financials for a new or growing venture. A breakeven and CVP analysis is a focused financial tool that typically appears as one section within a business plan. Standalone breakeven analyses are used for internal decisions, pricing reviews, and lender submissions where a full business plan is not required.

vs SWOT Analysis

A SWOT analysis is a qualitative strategic framework identifying strengths, weaknesses, opportunities, and threats. A breakeven analysis is quantitative β€” it produces specific numbers that trigger financial decisions. The two are complementary: a SWOT identifies strategic context while the breakeven analysis quantifies the financial floor the business must maintain within that context.

Industry-specific considerations

Manufacturing

High fixed costs from equipment and plant mean the breakeven point is sensitive to production volume; capacity utilization rate is a key input.

Retail / E-commerce

Variable costs include cost of goods sold, fulfillment, and payment processing fees; breakeven is typically expressed in monthly revenue rather than units due to diverse product mixes.

Food & Beverage / Restaurant

Food cost percentage (target 28–35% of revenue) and covers per day drive the variable cost structure; fixed costs are dominated by rent and labor.

Professional Services

Breakeven is calculated in billable hours or client engagements; utilization rate (target 65–75% of available hours) is the primary lever on profitability.

Template vs pro β€” what fits your needs?

PathBest forCostTime
Use the templateSmall business owners, founders, and managers running single-product or simple multi-product analysesFree2–4 hours to complete with actual cost data
Template + professional reviewBusinesses with complex cost structures, multiple product lines, or analyses destined for bank loan submissions$200–$600 for an accountant or financial analyst review1–2 days
Custom draftedPrivate equity due diligence, multi-site operations, or businesses requiring integrated CVP modeling within a full financial model$1,000–$4,000 for a financial consultant or CFO-for-hire engagement3–7 days

Glossary

Breakeven Point
The sales volume β€” in units or revenue dollars β€” at which total revenues exactly equal total costs, producing zero profit or loss.
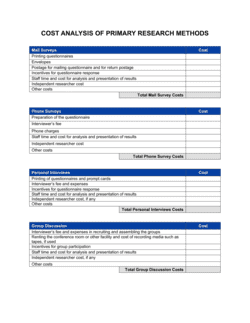
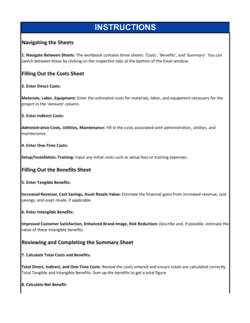
Fixed Costs
Costs that remain constant regardless of production or sales volume, such as rent, salaries, insurance, and depreciation.
Variable Costs
Costs that change in direct proportion to production or sales volume, such as raw materials, direct labor, and sales commissions.
Contribution Margin
Revenue minus variable costs β€” the amount each unit sold contributes toward covering fixed costs and generating profit.
Contribution Margin Ratio
Contribution margin expressed as a percentage of revenue, showing how many cents of each sales dollar cover fixed costs and profit.
Margin of Safety
The difference between actual or projected sales and the breakeven sales level β€” expressed in units or dollars β€” showing how far sales can fall before a loss occurs.
Cost-Volume-Profit (CVP) Analysis
A framework examining the relationship between costs, sales volume, and profit to support pricing, production, and strategic decisions.
Target Profit Volume
The sales volume required to achieve a specific profit goal, calculated by adding the target profit to fixed costs and dividing by the contribution margin per unit.
Semi-Variable Cost
A cost that has both a fixed base component and a variable component that changes with activity level, such as a utility bill with a fixed connection fee plus usage charges.
Operating Leverage
The degree to which a business relies on fixed costs; high operating leverage means profits grow rapidly above the breakeven point but losses deepen quickly below it.

Part of your Business Operating System

This document is one of 3,000+ business & legal templates included in Business in a Box.

  • Fill-in-the-blanks β€” ready in minutes
  • 100% customizable Word document
  • Compatible with all office suites
  • Export to PDF and share electronically

Create your document in 3 simple steps.

From template to signed document β€” all inside one Business Operating System.
1
Download or open template

Access over 3,000+ business and legal templates for any business task, project or initiative.

2
Edit and fill in the blanks with AI

Customize your ready-made business document template and save it in the cloud.

3
Save, Share, Send, Sign

Share your files and folders with your team. Create a space of seamless collaboration.

Save time, save money, and create top-quality documents.

β˜…β˜…β˜…β˜…β˜…

"Fantastic value! I'm not sure how I'd do without it. It's worth its weight in gold and paid back for itself many times."

Managing Director Β· Mall Farm
Robert Whalley
Managing Director, Mall Farm Proprietary Limited
β˜…β˜…β˜…β˜…β˜…

"I have been using Business in a Box for years. It has been the most useful source of templates I have encountered. I recommend it to anyone."

Business Owner Β· 4+ years
Dr Michael John Freestone
Business Owner
β˜…β˜…β˜…β˜…β˜…

"It has been a life saver so many times I have lost count. Business in a Box has saved me so much time and as you know, time is money."

Owner Β· Upstate Web
David G. Moore Jr.
Owner, Upstate Web

Run your business with a system β€” not scattered tools

Stop downloading documents. Start operating with clarity. Business in a Box gives you the Business Operating System used by over 250,000 companies worldwide to structure, run, and grow their business.

Free Forever PlanΒ Β·Β No credit card required