1
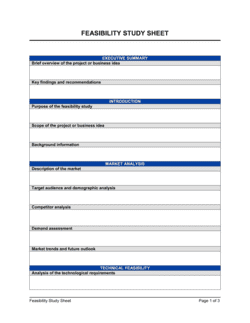
Define the project scope and objectives
Write a clear one-paragraph description of what the initiative involves, what problem it solves, and what measurable outcomes you expect. Set explicit scope boundaries so reviewers know what is and is not included.
💡 Frame objectives as outcomes, not activities — 'reduce invoice processing time by 40%' is stronger than 'implement new accounting software.'
2
Document all assumptions upfront
List the discount rate, benefit horizon (typically 3–5 years), FTE cost rates, inflation assumptions, and any constraints before building the cost or benefit tables. Every number in the analysis should trace back to a named assumption.
💡 A discount rate of 8–12% is a common baseline for corporate projects; check your organization's cost of capital or hurdle rate if one exists.
3
Build a complete cost inventory
Separate one-time costs (implementation, setup, training) from recurring costs (licensing, maintenance, support, additional headcount). Include indirect costs such as employee time spent on transition.
💡 Add a 10–15% contingency buffer to your total cost estimate — projects rarely come in under budget, and a buffer prevents the analysis from being invalidated by minor overruns.
4
Quantify all benefits with supporting logic
For each benefit, write out the calculation: hours saved × FTE rate, or revenue uplift × conversion rate. For intangible benefits, assign a conservative dollar range and note the basis for the estimate.
💡 Use conservative benefit estimates in your base case. An analysis that under-promises and over-delivers builds more credibility than one that inflates projections.
5
Calculate NPV, ROI, and payback period
Apply the discount rate to each year's net benefit to compute NPV. Divide total net benefit by total cost for ROI. Count the months from project launch until cumulative benefits exceed cumulative costs for the payback period.
💡 If the payback period exceeds the benefit horizon you selected, the project does not break even within the analysis window — flag this clearly rather than extending the horizon to make the numbers work.
6
Run a three-scenario sensitivity analysis
Create a base case, an optimistic case (benefits +30%, costs -10%), and a pessimistic case (benefits -30%, costs +20%). Show the NPV and ROI for each scenario in a summary table.
💡 If the pessimistic case still yields a positive NPV, the recommendation is straightforward. If the pessimistic NPV is negative, explain the risk mitigation strategy that closes the gap.
7
State a clear recommendation with conditions
Write a direct go/no-go recommendation supported by the headline metrics. If the recommendation is conditional — 'proceed only if vendor pricing can be reduced by 15%' — state the condition explicitly.
💡 Decision-makers who disagree with the recommendation need to challenge the assumptions, not the conclusion — make it easy for them by listing the top three assumptions the recommendation depends on.
8
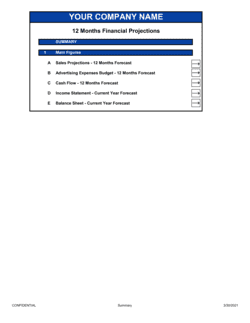
Write the executive summary last
Pull the project description, total cost, total benefit, NPV, ROI, payback period, and recommendation into a single summary page. This should be self-contained enough that a busy executive can form a view without reading the body.
💡 Keep the executive summary to one page. If it runs longer, the supporting detail has leaked into the summary — move it back to the relevant section.