Financial Report Template

Free Excel download β€’ Edit online β€’ Save & share with Drive β€’ Export to PDF

1 pageβ€’20–25 min to fillβ€’Difficulty: Standard
Learn more ↓
FreeXLSFinancial Report Template

At a glance

What it is
A Financial Report is a structured document that summarizes a company's revenue, expenses, profitability, cash position, and key financial metrics for a defined reporting period β€” typically monthly, quarterly, or annually. This free Word download gives you a ready-to-edit framework you can populate with your own figures and export as PDF to share with boards, lenders, investors, or management teams.
When you need it
Use it at the close of each reporting period to communicate financial performance to stakeholders, support budget reviews, or satisfy reporting obligations to lenders, investors, or a board of directors.
What's inside
Executive summary of financial highlights, income statement summary, cash flow overview, balance sheet snapshot, budget-vs-actual variance analysis, and key performance indicators β€” all organized in a logical narrative flow that non-finance readers can follow.

What is a Financial Report?

A Financial Report is a structured management document that consolidates a company's revenue, expenses, profitability, cash position, and key financial metrics for a defined reporting period β€” typically monthly, quarterly, or annually β€” into a single, narrative-driven summary. Unlike a raw accounting export, a financial report adds variance analysis, segment breakdowns, and forward-looking commentary to give boards, lenders, investors, and management teams the context they need to make decisions. It draws on the income statement, cash flow statement, and balance sheet as source inputs and organizes them alongside KPIs and written explanations into a coherent picture of financial health.

Why You Need This Document

Without a structured financial report, stakeholders receive disconnected spreadsheet exports with no narrative to explain what the numbers mean or what changed since last period. Lenders reviewing your account and investors tracking their capital need to see organized, comparable data β€” missing comparisons and unexplained variances are the fastest way to trigger a follow-up call or a covenant review. Internally, a report with a clear variance analysis turns a monthly close from a backward-looking accounting exercise into a tool that drives the decisions this week. Skipping the report entirely means performance problems go undetected until they become cash crises. This template gives you a repeatable format that takes two to four hours per period to complete and produces a document credible enough for a board meeting, a bank review, or an investor update.

Which variant fits your situation?

If your situation is…Use this template
Reporting results to a board or investors at the end of each monthMonthly Financial Report
Summarizing full-year performance for shareholders or external auditorsAnnual Financial Report
Comparing actual spending to budget line by line for a departmentBudget vs. Actual Report
Tracking and reporting only on cash inflows and outflowsCash Flow Statement
Presenting a financial snapshot of assets, liabilities, and equityBalance Sheet
Reporting revenue and expenses only, without a full balance sheetIncome Statement
Producing a forward-looking projection rather than historical resultsFinancial Projections (12 Months)

Common mistakes to avoid

❌ No prior-period or budget comparison column

Why it matters: A single column of actuals tells readers what happened but provides no basis for judging whether performance was good, bad, or in line with expectations. Stakeholders will ask the question verbally, wasting meeting time.

Fix: Always include at minimum two comparison columns β€” prior period and current-period budget β€” alongside every major financial line.

❌ Variance table with no narrative explanation

Why it matters: A table of red numbers without context leads readers to assume the worst. Material variances left unexplained become the subject of speculation and erode trust in management.

Fix: Write a root-cause sentence for every variance that exceeds 10% of the budgeted figure, and state whether it is a one-time item or a recurring trend.

❌ Omitting a cash flow summary when the business is profitable

Why it matters: Accrual net income and cash generation can diverge significantly due to AR timing, inventory build, or debt repayment. Profitable businesses fail when they run out of cash β€” lenders and investors always check both.

Fix: Include a condensed cash flow summary in every report regardless of profitability. A three-line summary (operating, investing, financing) and a closing cash balance takes under an hour to add.

❌ Reporting too many KPIs with no prioritization

Why it matters: A scorecard with 20 metrics diffuses attention and makes it impossible for readers to identify where action is required. Everything flagged as important means nothing is.

Fix: Limit the KPI scorecard to six to eight metrics, and designate two or three as the primary indicators that management monitors most closely each period.

❌ Publishing a report with a balance sheet that does not balance

Why it matters: Assets that do not equal liabilities plus equity signal a data entry error or a reconciliation failure, immediately undermining confidence in every other number in the report.

Fix: Build a simple formula check into the template that flags a non-zero difference between total assets and total liabilities plus equity before the document is shared.

❌ No forward-looking commentary in the final section

Why it matters: A report that ends with last period's results leaves stakeholders with no basis for the decisions they need to make today. The primary value of a financial report is informing future action, not documenting the past.

Fix: Add at least two sentences of forward commentary to every report β€” known revenue events, expected cost changes, and any revised outlook for the current period.

The 9 key sections, explained

Executive summary of financial highlights

Income statement summary

Revenue breakdown by segment or product

Expense analysis by category

Cash flow summary

Balance sheet snapshot

Budget-vs-actual variance analysis

Key financial KPIs

Outlook and forward-looking commentary

How to fill it out

  1. 1

    Define the reporting period and audience

    Set the exact start and end dates of the reporting period at the top of the template. Confirm who will receive the report β€” board, lenders, investors, or internal management β€” because this determines how much detail and how much narrative context you need to include.

    πŸ’‘ Lock in a consistent cut-off date (e.g., the 5th business day after month-end) and stick to it β€” late reports erode stakeholder confidence more than small misses do.

  2. 2

    Pull final figures from your accounting system

    Export your trial balance or finalized P&L, balance sheet, and cash flow statement from your accounting software for the period. Reconcile the closing cash balance on the cash flow statement to the bank statement before proceeding.

    πŸ’‘ Never populate the report from a draft or unreconciled trial balance. One correcting journal entry after publication forces a restatement and damages credibility.

  3. 3

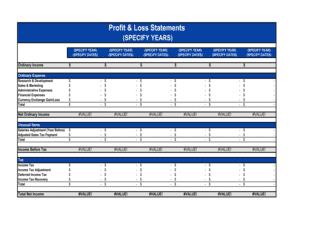
    Populate the income statement summary with comparisons

    Enter actual revenue, COGS, gross profit, operating expenses by category, and net income. Add prior-period actuals and budget figures in the adjacent columns so readers can see context at a glance.

    πŸ’‘ Highlight any line where the variance exceeds 10% of budget in either direction β€” these are the lines that will generate questions, so address them in the variance narrative.

  4. 4

    Break revenue down by segment

    Disaggregate total revenue into your primary segments β€” product lines, geographies, customer tiers, or service types. Calculate each segment's share of total revenue and its growth rate versus the prior period.

    πŸ’‘ If one segment represents more than 50% of revenue and is declining, call it out explicitly in the executive summary rather than burying it in a table.

  5. 5

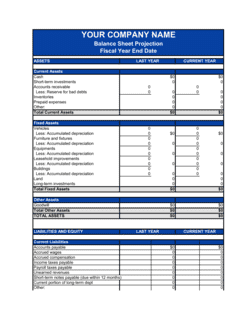
    Complete the cash flow summary and balance sheet snapshot

    Transfer the three cash flow subtotals (operating, investing, financing) and calculate closing cash. Then enter the balance sheet totals β€” current assets, total assets, current liabilities, total liabilities, and equity β€” and verify the accounting equation balances.

    πŸ’‘ Include a cash runway calculation (closing cash Γ· average monthly burn) on the cash flow summary. It takes 30 seconds and is the first number many investors look for.

  6. 6

    Write the variance narrative

    For each variance that exceeds your materiality threshold, write one to three sentences explaining the root cause and whether it is a timing difference, a permanent change, or a one-time item. Avoid euphemisms β€” state the actual reason plainly.

    πŸ’‘ Separate favorable variances from unfavorable ones into distinct paragraphs. Mixing them makes the narrative harder to scan.

  7. 7

    Add the KPI scorecard and forward outlook

    Populate the KPI table with actuals, targets, and prior-period figures. Then write two to four sentences on what you expect in the next period, including any known events that will materially affect revenue or cash.

    πŸ’‘ Flag any KPI that has missed target for two consecutive periods β€” escalate it in the outlook section rather than waiting for the trend to become a crisis.

Frequently asked questions

What is a financial report?

A financial report is a structured document that summarizes a company's financial performance and position for a defined reporting period β€” typically monthly, quarterly, or annually. It combines an income statement summary, cash flow overview, balance sheet snapshot, and variance analysis into a single narrative document designed for boards, lenders, investors, or senior management. Unlike raw accounting output, a financial report adds context and interpretation to the numbers.

What should a financial report include?

A complete financial report covers eight core components: an executive summary of highlights, an income statement summary with prior-period and budget comparisons, a revenue breakdown by segment, an expense analysis by category, a cash flow summary, a balance sheet snapshot, a budget-vs-actual variance narrative, and a KPI scorecard. Most reports also include a brief forward-looking outlook for the next period.

How is a financial report different from a financial statement?

A financial statement β€” P&L, balance sheet, or cash flow statement β€” is a formal accounting output that presents raw figures according to accounting standards. A financial report wraps those figures in narrative context: variance explanations, KPI commentary, and a forward outlook. Financial statements are the input; the financial report is the management communication built on top of them.

How often should a financial report be prepared?

Most businesses prepare a management financial report monthly. Quarterly reports are common for boards that meet four times a year. Annual reports summarize full-year performance and are typically required by lenders, investors, and any regulated entity. Startups backed by investors often provide monthly reports as a condition of their investment agreement.

Who should receive a financial report?

The audience determines the format and depth. Board members and investors typically receive a summary report with narrative and KPIs β€” five to eight pages. Lenders may require a specific format defined in the loan agreement. Internal management teams often receive a more detailed version with full department-level expense breakdowns. Tailor the level of detail to what each audience needs to make decisions.

Do I need an accountant to prepare a financial report?

For straightforward businesses with clean books, a finance manager or even a detail-oriented business owner can prepare a solid management financial report using a structured template. An accountant or CFO adds value when the business has complex revenue recognition, multi-entity consolidations, debt covenants that trigger specific reporting requirements, or when the report will be used for a capital raise or audit. For most small businesses, the template covers the full scope.

What is the difference between a financial report and a budget?

A budget is a forward-looking plan that sets targets for revenue and spending in a future period. A financial report is a backward-looking document that records what actually happened. The two are most useful together: the variance analysis section of a financial report compares actuals to the budget line by line and explains the differences, which in turn informs the next budget revision.

What financial KPIs should appear in a financial report?

The right KPIs depend on the business model, but a core set for most businesses includes gross margin percentage, EBITDA, net income margin, operating cash flow, accounts receivable days outstanding, and working capital. SaaS companies add MRR, churn rate, and CAC payback period. Retailers track inventory turnover and gross margin by category. Limit the scorecard to six to eight metrics so readers know which ones matter most.

Can a financial report be used to secure financing?

Yes β€” lenders and investors routinely request the last two to four quarters of management financial reports as part of due diligence. A well-structured report with clean variance explanations and realistic forward commentary signals strong financial management and accelerates the underwriting process. Conversely, reports with missing comparisons, unexplained variances, or balance sheets that do not balance raise immediate red flags.

How this compares to alternatives

vs Income Statement (P&L)

An income statement is a single financial statement showing revenue, expenses, and net income for a period β€” pure accounting output with no narrative. A financial report uses the income statement as one of several inputs and adds variance analysis, cash flow context, KPIs, and management commentary. Use the income statement for accounting and tax purposes; use the financial report for stakeholder communication.

vs Cash Flow Statement

A cash flow statement is a formal accounting document tracking cash inflows and outflows across operating, investing, and financing activities. A financial report includes a condensed cash flow summary as one section alongside profitability and balance sheet data. The standalone cash flow statement is the source document; the financial report contextualizes it alongside the full financial picture.

vs Financial Projections (12 Months)

Financial projections are forward-looking estimates of future revenue, expenses, and cash. A financial report is backward-looking, documenting what actually occurred. The two complement each other: the financial report's variance analysis updates the assumptions that drive the projections. Use projections for planning and fundraising; use the financial report to track performance against those projections.

vs Budget vs. Actual Report

A budget-vs-actual report is a focused comparison document that shows every budget line next to the actual result and the variance β€” typically a detailed spreadsheet. A financial report is broader, combining that variance analysis with narrative context, cash flow, balance sheet, and KPIs in a single stakeholder-ready document. The budget-vs-actual output typically feeds the variance section of the financial report.

Industry-specific considerations

SaaS / Technology

MRR, ARR, churn rate, CAC payback, and net revenue retention are the headline KPIs; the expense analysis separates R&D, sales, and G&A to monitor burn by function.

Retail / E-commerce

Revenue breakdown by channel (online vs. in-store), gross margin by product category, inventory turnover, and average order value drive the segment and KPI sections.

Professional Services

Billable utilization rate, revenue per billable employee, and unbilled work-in-progress are the critical KPIs alongside a project-level revenue breakdown.

Nonprofit

Revenue is reported by funding source (grants, donations, program fees), and the variance section explains any grant spending that differs from award budgets β€” a requirement for most funders.

Template vs pro β€” what fits your needs?

PathBest forCostTime
Use the templateSmall businesses, startups, and finance managers preparing standard monthly or quarterly management reportsFree2–4 hours per reporting period
Template + professional reviewBusinesses reporting to external investors, preparing for a loan review, or adding multi-entity consolidation$200–$800 per report (bookkeeper or fractional CFO review)1–2 days
Custom draftedCompanies with audit requirements, complex debt covenants, multi-currency operations, or formal investor reporting obligations$1,500–$5,000+ (CPA firm or full-service CFO engagement)1–2 weeks

Glossary

Reporting Period
The specific time interval covered by a financial report β€” commonly monthly, quarterly, or annual.
Gross Profit
Revenue minus the direct cost of goods sold or services delivered, before operating expenses are deducted.
Net Income
The bottom-line profit remaining after all revenues, expenses, taxes, and interest have been accounted for.
EBITDA
Earnings Before Interest, Taxes, Depreciation, and Amortization β€” a measure of core operating profitability used widely in management reporting.
Variance
The difference between a budgeted or forecasted figure and the actual result, expressed as a dollar amount or percentage.
Working Capital
Current assets minus current liabilities β€” a measure of short-term liquidity and the ability to meet obligations within the next 12 months.
Accounts Receivable (AR)
Money owed to the business by customers for goods or services already delivered but not yet paid for.
Accounts Payable (AP)
Money the business owes to suppliers or vendors for goods or services received but not yet paid.
Cash Runway
The number of months a business can continue operating at its current burn rate before exhausting available cash.
KPI (Key Performance Indicator)
A quantifiable metric used to evaluate progress toward a specific financial or operational objective.
Accrual Accounting
A method that records revenue when earned and expenses when incurred, regardless of when cash actually changes hands.

Part of your Business Operating System

This document is one of 3,000+ business & legal templates included in Business in a Box.

  • Fill-in-the-blanks β€” ready in minutes
  • 100% customizable Word document
  • Compatible with all office suites
  • Export to PDF and share electronically

Create your document in 3 simple steps.

From template to signed document β€” all inside one Business Operating System.
1
Download or open template

Access over 3,000+ business and legal templates for any business task, project or initiative.

2
Edit and fill in the blanks with AI

Customize your ready-made business document template and save it in the cloud.

3
Save, Share, Send, Sign

Share your files and folders with your team. Create a space of seamless collaboration.

Save time, save money, and create top-quality documents.

β˜…β˜…β˜…β˜…β˜…

"Fantastic value! I'm not sure how I'd do without it. It's worth its weight in gold and paid back for itself many times."

Managing Director Β· Mall Farm
Robert Whalley
Managing Director, Mall Farm Proprietary Limited
β˜…β˜…β˜…β˜…β˜…

"I have been using Business in a Box for years. It has been the most useful source of templates I have encountered. I recommend it to anyone."

Business Owner Β· 4+ years
Dr Michael John Freestone
Business Owner
β˜…β˜…β˜…β˜…β˜…

"It has been a life saver so many times I have lost count. Business in a Box has saved me so much time and as you know, time is money."

Owner Β· Upstate Web
David G. Moore Jr.
Owner, Upstate Web

Run your business with a system β€” not scattered tools

Stop downloading documents. Start operating with clarity. Business in a Box gives you the Business Operating System used by over 250,000 companies worldwide to structure, run, and grow their business.

Start freeΒ Β·Β No credit card required