1
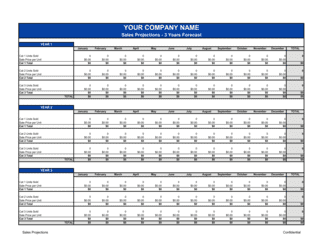
Enter your current MRR and customer count
Start with actual figures from your billing system — current MRR, active customer count, and average revenue per user (ARPU). These are the anchors every downstream projection builds on.
💡 Segment ARPU by plan tier (starter, professional, enterprise) from day one — blended ARPU masks the mix shift that drives most SaaS growth stories.
2
Set your monthly growth and churn rate assumptions
Enter your projected new customer additions per month and your current monthly churn rate. For early-stage companies, use the last 3-month average; for pre-revenue companies, benchmark against comparable SaaS businesses at your stage.
💡 Benchmark monthly churn against stage: seed-stage SaaS typically runs 3–7% monthly, while mature SaaS businesses target below 1%. Use realistic numbers — investors stress-test these immediately.
3
Build the CAC and LTV inputs
Enter total sales and marketing spend by month (headcount only — exclude all-hands costs), divide by new customers acquired, and calculate gross-margin-adjusted ARPU to derive LTV and the LTV:CAC ratio.
💡 A LTV:CAC ratio below 3:1 at Series A will trigger questions about capital efficiency — flag it proactively and show your improvement trajectory.
4
Itemize cost of revenue line by line
List each COGS component separately: hosting and infrastructure, third-party API or licensing fees, customer success headcount, and implementation costs. Calculate gross margin for each projected period.
💡 Target gross margins above 70% for a software-only product and above 60% for a product with significant services. If you are below these thresholds, flag the path to improvement explicitly.
5
Model headcount-driven OpEx in steps
Build your R&D, S&M, and G&A expense lines by mapping planned hires to specific months. Each hire creates a step-change in cost — model it as such rather than as a smooth percentage of revenue.
💡 Include a headcount plan tab with hire dates, fully-loaded cost (salary plus 20–25% for benefits and taxes), and the revenue or milestone trigger for each role.
6
Link the three financial statements
Connect P&L net income to the cash flow statement's operating section, then carry ending cash to the balance sheet. Verify that total assets equal total liabilities plus equity in every period.
💡 A simple linking check: ending cash on the balance sheet must match ending cash on the cash flow statement exactly — if they differ by even $1, there is a formula error somewhere.
7
Build the sensitivity table
Create at least three scenarios — base, upside (120% of base growth), and downside (70% of base growth with 1.5× churn) — and show the ARR, runway, and cash position outcomes for each.
💡 Show investors the downside scenario first and explain what operational levers you would pull (reduce hiring, cut S&M spend) to extend runway — this signals financial maturity.
8
Populate the metrics dashboard and validate
Fill the key metrics summary with ARR, NRR, gross margin, CAC payback, LTV:CAC, Rule of 40, and runway figures pulled directly from the model. Cross-check every metric against the detailed schedules.
💡 Have someone who did not build the model attempt to reconcile each dashboard metric back to its source calculation — discrepancies reveal formula errors before the model reaches an investor.