Break-even Analysis Template

Free Excel download β€’ Use online β€’ Print or share

2 pagesβ€’20–25 min to useβ€’Difficulty: Standard
Learn more ↓
FreeXLSBreak-even Analysis Template

At a glance

What it is
A Break Even Analysis is a financial planning document that calculates the exact sales volume β€” in units or revenue dollars β€” at which total revenues equal total costs, producing neither profit nor loss. This free Word download gives you a structured template to map fixed costs, variable costs, contribution margin, and break even point in a single document you can edit online and export as PDF to share with lenders, investors, or your leadership team.
When you need it
Use it when launching a new product or business, evaluating a price change, assessing whether to add a new cost (hire, lease, equipment), or preparing financial projections for a bank loan or investor pitch.
What's inside
Business and product overview, fixed and variable cost schedules, unit selling price, contribution margin calculation, break even point in units and revenue, margin of safety, and a break even chart with scenario analysis for optimistic and pessimistic cases.

What is a Break Even Analysis?

A Break Even Analysis is a financial planning document that calculates the exact sales volume β€” measured in units sold or revenue dollars β€” at which a business's total revenues equal its total costs, producing a net result of exactly zero. It works by separating all costs into two categories β€” fixed costs that do not change with volume and variable costs that increase with each unit produced or sold β€” then calculating the contribution margin each unit generates toward covering those fixed costs. The break even point is the volume at which enough contribution margin has accumulated to cover all fixed costs. Beyond that threshold, every additional unit sold generates profit; below it, every unit sold produces a loss.

Why You Need This Document

Without a break even analysis, pricing decisions, hiring plans, and capital expenditure approvals rest on intuition rather than quantified thresholds. A founder who doesn't know their break even point has no way to evaluate whether a new lease, an additional hire, or a price reduction will push the business deeper into loss or accelerate it toward profitability. Lenders routinely request a break even analysis as part of any loan application because it demonstrates that the business owner understands their own cost structure. Investors use the margin of safety figure β€” the gap between projected sales and the break even point β€” to assess downside risk before committing capital. This template gives you a structured, calculation-ready format that produces all the outputs a banker, investor, or internal decision-maker needs, in a fraction of the time required to build one from scratch.

Which variant fits your situation?

If your situation is…Use this template
Analyzing a single product or service with one price pointBreak Even Analysis (Single Product)
Evaluating a new product launch within an existing businessNew Product Launch Plan
Building a full financial model for a bank or investorFinancial Projections (12 Months)
Assessing whether a price increase covers rising input costsCost-Benefit Analysis
Deciding whether to open a second location or expand capacityBusiness Expansion Plan
Preparing a complete investor-ready business planBusiness Plan

Common mistakes to avoid

❌ Mixing multiple products in one analysis

Why it matters: Different products have different margins and cost structures. A blended analysis produces a BEP that is accurate for none of the products and can lead to decisions that lose money on individual lines.

Fix: Run a separate break even analysis for each distinct product or service. Combine them only in a weighted-average portfolio analysis after individual analyses are complete.

❌ Excluding owner compensation from fixed costs

Why it matters: When the owner's salary is treated as profit rather than a cost, fixed costs are understated and the BEP appears lower than it really is β€” making the business look more viable than it is to lenders or investors.

Fix: Enter a market-rate salary for the owner as a fixed cost line item, even if the owner is not currently drawing that salary.

❌ Using estimated rather than actual variable costs

Why it matters: Estimates that understate variable costs by even 10–15% can shift the BEP significantly β€” enough to make an unprofitable product look viable.

Fix: Pull variable cost figures from actual supplier invoices, payroll records, and transaction fee statements from the most recent full operating period.

❌ Presenting only the base-case BEP with no scenario analysis

Why it matters: A single BEP number gives a false sense of precision. Real-world input costs and prices fluctuate, and a decision based on one scenario can fail quickly when conditions change.

Fix: Always model at least an optimistic and a pessimistic case, and present the BEP as a range rather than a single point.

The 9 key sections, explained

Business and product overview

Fixed cost schedule

Variable cost per unit

Selling price per unit

Contribution margin calculation

Break even point in units and revenue

Margin of safety

Break even chart

Scenario analysis

How to fill it out

  1. 1

    Define the scope: one product, one period

    Enter the company name, the specific product or service being analyzed, and the time period β€” typically one month or one year. If you sell multiple products, run a separate analysis for each.

    πŸ’‘ Use a monthly analysis when costs and revenues fluctuate seasonally; use an annual analysis for stable businesses applying for a bank loan.

  2. 2

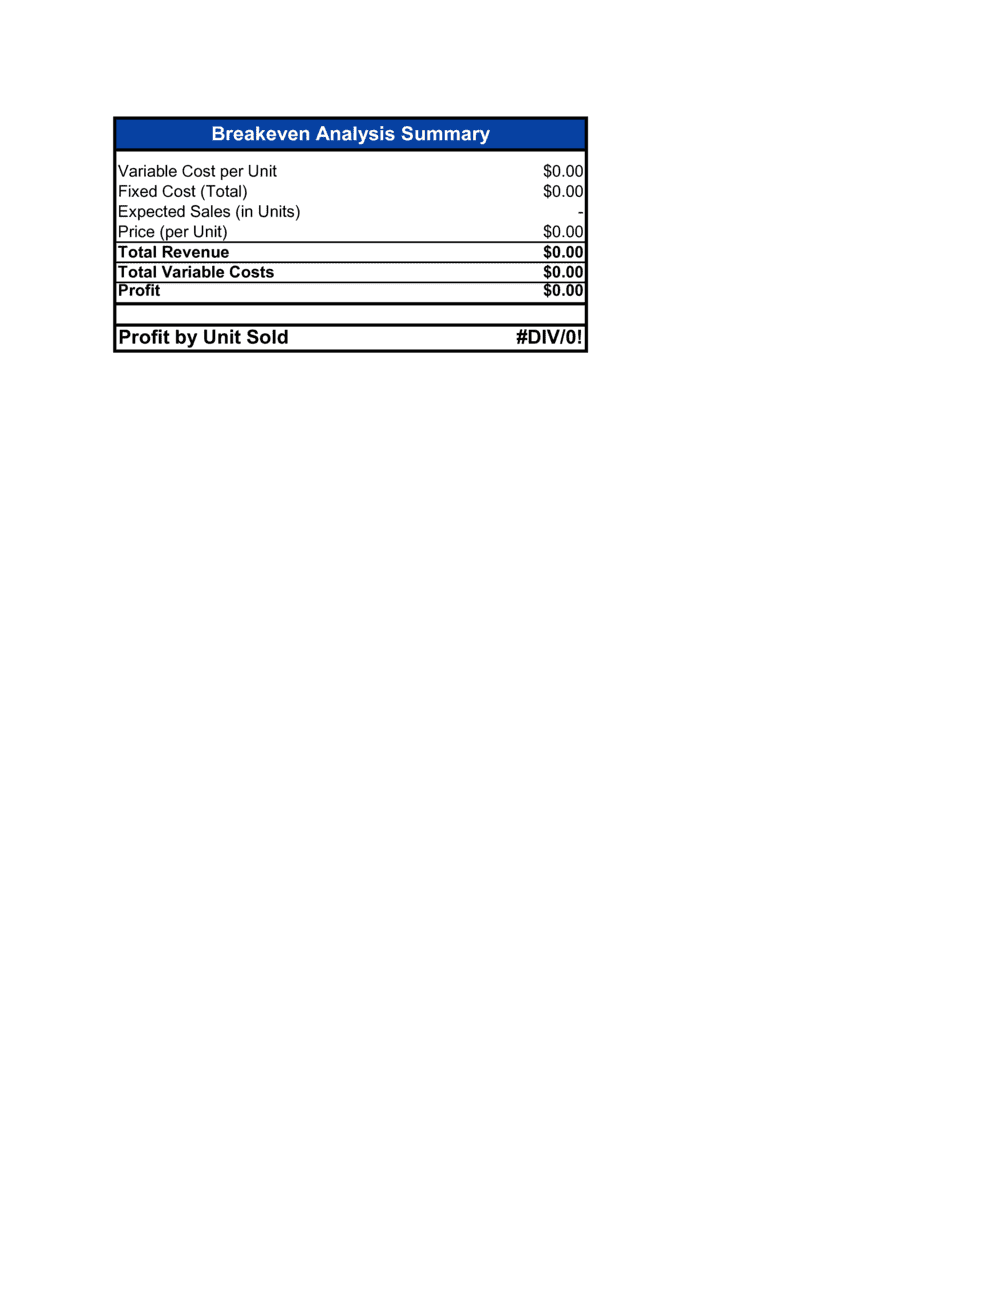
    List every fixed cost for the period

    Enter each fixed cost as a separate line item β€” rent, utilities, salaries, loan repayments, insurance, software. Total them at the bottom of the schedule.

    πŸ’‘ Include owner or founder compensation as a fixed cost. If you exclude it, your BEP will be understated and the analysis will mislead any external reader.

  3. 3

    Calculate variable cost per unit

    List every cost that increases with each unit sold β€” materials, direct labor, packaging, shipping, commissions, and payment processing fees. Sum them to get your total variable cost per unit.

    πŸ’‘ Pull variable costs from recent supplier invoices and payroll records rather than estimates. Actual numbers produce a BEP you can rely on.

  4. 4

    Enter the selling price per unit

    Enter the price the customer pays, net of any standard discounts or rebates. Document the pricing basis (cost-plus, market, or value-based) so the analysis is self-explanatory to any reviewer.

    πŸ’‘ If you offer volume discounts, run a separate BEP for each pricing tier rather than averaging them.

  5. 5

    Calculate contribution margin and contribution margin ratio

    Subtract variable cost per unit from the selling price to get contribution margin per unit. Divide that figure by the selling price to get the contribution margin ratio.

    πŸ’‘ A contribution margin ratio below 30% typically signals a pricing or cost structure problem worth addressing before scaling.

  6. 6

    Apply the BEP formulas

    Divide total fixed costs by contribution margin per unit to get BEP in units. Divide total fixed costs by the contribution margin ratio to get BEP in revenue dollars. Enter both in the results section.

    πŸ’‘ Cross-check: BEP units multiplied by selling price should equal β€” or be very close to β€” your BEP in revenue dollars. A mismatch means a formula error.

  7. 7

    Calculate the margin of safety

    Subtract the BEP from projected or actual sales in both units and revenue. Divide by projected sales to get the margin of safety percentage.

    πŸ’‘ A margin of safety below 15% means a modest sales shortfall pushes the business into a loss. Flag this prominently when sharing the analysis with stakeholders.

  8. 8

    Run and label the scenario analysis

    Model at least three scenarios β€” base, optimistic, and pessimistic β€” by adjusting price, variable costs, or fixed costs. Label each scenario clearly and summarize the BEP range in a single conclusions paragraph.

    πŸ’‘ The gap between your optimistic and pessimistic BEP is more useful to a decision-maker than any single number β€” lead with the range in your summary.

Frequently asked questions

What is a break even analysis?

A break even analysis is a financial calculation that determines the exact sales volume β€” in units or revenue dollars β€” at which a business covers all of its costs and produces neither profit nor loss. It uses three inputs: total fixed costs, variable cost per unit, and selling price per unit. The result tells managers the minimum performance threshold the business must clear to avoid losing money.

What is the break even point formula?

The break even point in units is calculated by dividing total fixed costs by the contribution margin per unit (selling price minus variable cost per unit). The break even point in revenue dollars is calculated by dividing total fixed costs by the contribution margin ratio (contribution margin per unit divided by selling price). Both outputs are useful β€” units for production planning, revenue for financial reporting.

What is contribution margin and why does it matter?

Contribution margin is the amount each unit sold contributes toward covering fixed costs after variable costs are paid. It is calculated as selling price minus variable cost per unit. A higher contribution margin means fewer units are needed to reach the break even point. It is the single most important lever in a break even analysis β€” improving it through higher prices or lower variable costs directly reduces the BEP.

When should I use a break even analysis?

Use a break even analysis before launching a new product, setting or changing a price, hiring additional staff, signing a lease, or purchasing equipment. It is also a standard component of a business plan submitted to a bank or investor. Any time you are committing to a fixed cost that increases your BEP, a break even analysis helps you quantify the additional sales volume required to justify that commitment.

What is the difference between break even analysis and profit and loss projection?

A break even analysis identifies the minimum sales threshold to avoid a loss β€” it answers whether the business model is viable at a given price and cost structure. A profit and loss projection models expected revenue and costs across a future period to forecast actual profit. Break even analysis is typically a prerequisite to building a P&L projection β€” you need to know the floor before you can forecast performance above it.

How does the margin of safety relate to the break even point?

The margin of safety measures how far actual or projected sales exceed the break even point, expressed in units, dollars, and as a percentage of sales. A margin of safety of 25% means sales would have to fall 25% before the business starts losing money. Lenders and investors use this figure to assess downside risk β€” a low margin of safety signals that the business has limited tolerance for any revenue shortfall.

Can a break even analysis be used for a service business?

Yes. For a service business, replace unit with a billable hour, a client engagement, or a service transaction. Variable costs become the direct labor and materials cost of delivering one unit of service. The same formulas apply. Service businesses with high fixed costs and low variable costs (such as SaaS or consulting firms) typically have high contribution margins and lower BEPs relative to revenue.

How often should a break even analysis be updated?

Update the analysis whenever a significant input changes β€” a price increase, a new supplier contract, a lease renewal, or a material change in labor costs. For active businesses, a quarterly review is standard. For businesses in a pricing negotiation or cost-reduction initiative, running the analysis before and after the proposed change quantifies the exact impact on the break even threshold.

Do I need accounting software to perform a break even analysis?

No. A break even analysis requires only basic arithmetic β€” addition, subtraction, and division. A structured Word or Excel template covers the full calculation without specialized software. Accounting software can pull actual cost data automatically, which improves accuracy, but the analysis itself can be completed manually in under an hour using invoices, payroll records, and a price list.

How this compares to alternatives

vs Financial Projections (12 Months)

A financial projection models expected revenue, costs, and profit across a defined future period. A break even analysis identifies the minimum sales threshold required to avoid a loss. Break even analysis answers 'can this business cover its costs?'; financial projections answer 'how much will this business earn?' Use break even analysis first to validate the model, then build projections on top of it.

vs Cost-Benefit Analysis

A cost-benefit analysis compares the total costs of a decision against the total expected benefits to determine net value. A break even analysis focuses specifically on the sales volume required to recover costs β€” it does not weigh qualitative benefits or long-term strategic value. Use cost-benefit analysis for investment or policy decisions; use break even analysis for pricing and volume decisions.

vs Business Plan

A business plan is a 20–35 page document covering market analysis, strategy, operations, team, and financial projections for an external audience such as investors or lenders. A break even analysis is a single-purpose financial calculation typically included as a supporting section within the business plan. The break even analysis feeds the financial projections section of the plan.

vs Profit and Loss Statement

A profit and loss statement reports historical revenue, costs, and net income for a completed period. A break even analysis is forward-looking and hypothetical β€” it models the volume required to reach zero profit under a given cost and price structure. Both are necessary financial tools, but they answer different questions: the P&L tells you what happened; the break even analysis tells you what must happen.

Industry-specific considerations

Retail and e-commerce

Break even analysis incorporates per-unit shipping, payment processing fees, and returns rate as variable costs, alongside rent and staffing as fixed costs.

Food and beverage

Food cost percentage and labor as variable costs are central inputs; the analysis determines the minimum daily covers or weekly revenue needed to cover a location's fixed overhead.

SaaS and technology

Cloud hosting and customer support scale with user volume as variable costs; high contribution margins typically produce a BEP measured in MRR rather than units.

Manufacturing

Raw materials, direct labor, and machine runtime costs are variable; factory overhead, depreciation, and fixed salaries are fixed β€” making break even analysis essential before any production run commitment.

Template vs pro β€” what fits your needs?

PathBest forCostTime
Use the templateSmall business owners, founders, and managers performing standard single-product break even calculations for internal decisions or basic loan applicationsFree1–3 hours
Template + professional reviewBusinesses with semi-variable costs, multiple product lines, or break even analyses submitted to institutional lenders or investors$200–$600 for an accountant or financial advisor review1–2 days
Custom draftedComplex multi-product or multi-location analyses, regulated industries, or analyses integrated into a full financial model for a Series A raise$800–$3,000+ for a financial analyst or CFO-services firm3–7 days

Glossary

Break Even Point (BEP)
The sales volume β€” measured in units or revenue dollars β€” at which total revenues exactly equal total costs, resulting in zero profit or loss.
Fixed Costs
Costs that remain constant regardless of production or sales volume, such as rent, salaries, insurance, and loan repayments.
Variable Costs
Costs that change in direct proportion to production or sales volume, such as raw materials, packaging, and sales commissions.
Contribution Margin
The amount each unit sold contributes toward covering fixed costs, calculated as selling price minus variable cost per unit.
Contribution Margin Ratio
Contribution margin expressed as a percentage of the selling price, used to calculate the break even point in revenue dollars.
Margin of Safety
The difference between actual or projected sales and the break even point β€” the cushion before the business begins to lose money.
Selling Price per Unit
The revenue received for a single unit sold, before any costs are deducted.
Semi-Variable Costs
Costs that have a fixed base component plus a variable element that increases with volume β€” such as a utility bill with a flat connection fee and a per-unit consumption charge.
Sensitivity Analysis
A method of testing how the break even point changes when one or more assumptions β€” price, volume, or costs β€” are adjusted by a defined percentage.
Operating Leverage
The degree to which a business relies on fixed costs relative to variable costs; high operating leverage means profits grow quickly above the break even point but losses grow quickly below it.

Part of your Business Operating System

This document is one of 3,000+ business & legal templates included in Business in a Box.

  • Fill-in-the-blanks β€” ready in minutes
  • 100% customizable Word document
  • Compatible with all office suites
  • Export to PDF and share electronically

Create your document in 3 simple steps.

From template to signed document β€” all inside one Business Operating System.
1
Download or open template

Access over 3,000+ business and legal templates for any business task, project or initiative.

2
Edit and fill in the blanks with AI

Customize your ready-made business document template and save it in the cloud.

3
Save, Share, Send, Sign

Share your files and folders with your team. Create a space of seamless collaboration.

Save time, save money, and create top-quality documents.

β˜…β˜…β˜…β˜…β˜…

"Fantastic value! I'm not sure how I'd do without it. It's worth its weight in gold and paid back for itself many times."

Managing Director Β· Mall Farm
Robert Whalley
Managing Director, Mall Farm Proprietary Limited
β˜…β˜…β˜…β˜…β˜…

"I have been using Business in a Box for years. It has been the most useful source of templates I have encountered. I recommend it to anyone."

Business Owner Β· 4+ years
Dr Michael John Freestone
Business Owner
β˜…β˜…β˜…β˜…β˜…

"It has been a life saver so many times I have lost count. Business in a Box has saved me so much time and as you know, time is money."

Owner Β· Upstate Web
David G. Moore Jr.
Owner, Upstate Web

Run your business with a system β€” not scattered tools

Stop downloading documents. Start operating with clarity. Business in a Box gives you the Business Operating System used by over 250,000 companies worldwide to structure, run, and grow their business.

Free Forever PlanΒ Β·Β No credit card required