1
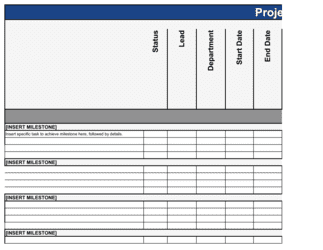
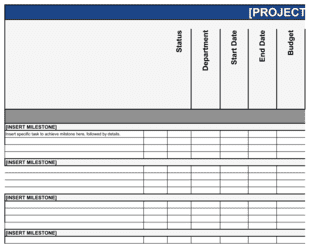
Enter project context and baseline values
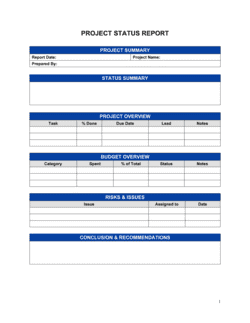
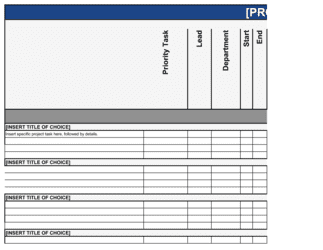
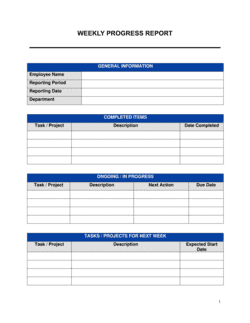
Fill in the project name, PM, reporting period, and the original approved baseline for schedule, budget, scope, quality, and utilization. These baseline numbers are the fixed reference point for every subsequent report.
💡 Lock the baseline on the day the project is formally approved — changes after kickoff require a documented re-baseline decision, not a quiet edit.
2
Calculate Schedule Performance Index
Divide Earned Value by Planned Value to get SPI. Then count milestones completed on time versus total milestones due in the period. Both figures together give a fuller picture of schedule health than either alone.
💡 If you do not have a formal EV system, use percentage of deliverables completed on time as a proxy SPI — it is less precise but far better than no measure at all.
3
Calculate Cost Performance Index and forecast variance at completion
Divide Earned Value by Actual Cost to get CPI. Then project total cost at completion using Budget at Completion divided by CPI to calculate Variance at Completion.
💡 A CPI below 0.9 for two consecutive periods almost never self-corrects — flag it for sponsor review immediately rather than waiting for end-of-phase reporting.
4
Document scope changes and unapproved additions
Log all approved change requests by number and check for work being performed that has no change order. Count both, and calculate the percentage of original scope still intact.
💡 A weekly scope-change audit — comparing the work log to the approved scope statement — catches unapproved additions before they compound.
5
Record quality acceptance rate and defects
Count deliverables reviewed in the period, how many passed on first review, and how many defects or rework items were logged. Calculate the first-pass acceptance rate as a percentage.
💡 Set your quality threshold before the project starts — for example, a 90% first-pass acceptance rate. Without a defined threshold, teams debate whether the number is acceptable every single reporting cycle.
6
Calculate resource utilization for the period
Divide total hours logged to the project by total available team hours for the period. Flag anyone consistently above 85% or below 60% for workload rebalancing.
💡 Distinguish between logged hours on project tasks and total hours worked — overtime padding the denominator can mask genuine over-allocation.
7
Write corrective actions with named owners and dates
For every metric showing yellow or red, write one specific action, assign it to a named team member, and set a resolution date no more than one reporting cycle out.
💡 If the same corrective action appears for three consecutive periods, escalate to the project sponsor — it signals a structural constraint the team cannot resolve independently.
8
Set next-period targets and distribute the report
Enter the target value for each metric in the next reporting cycle, adjusting for any re-baselines. Export as PDF and distribute to stakeholders before the next status meeting.
💡 Send the report at least 24 hours before the status meeting so stakeholders arrive with questions rather than spending meeting time reading the data.