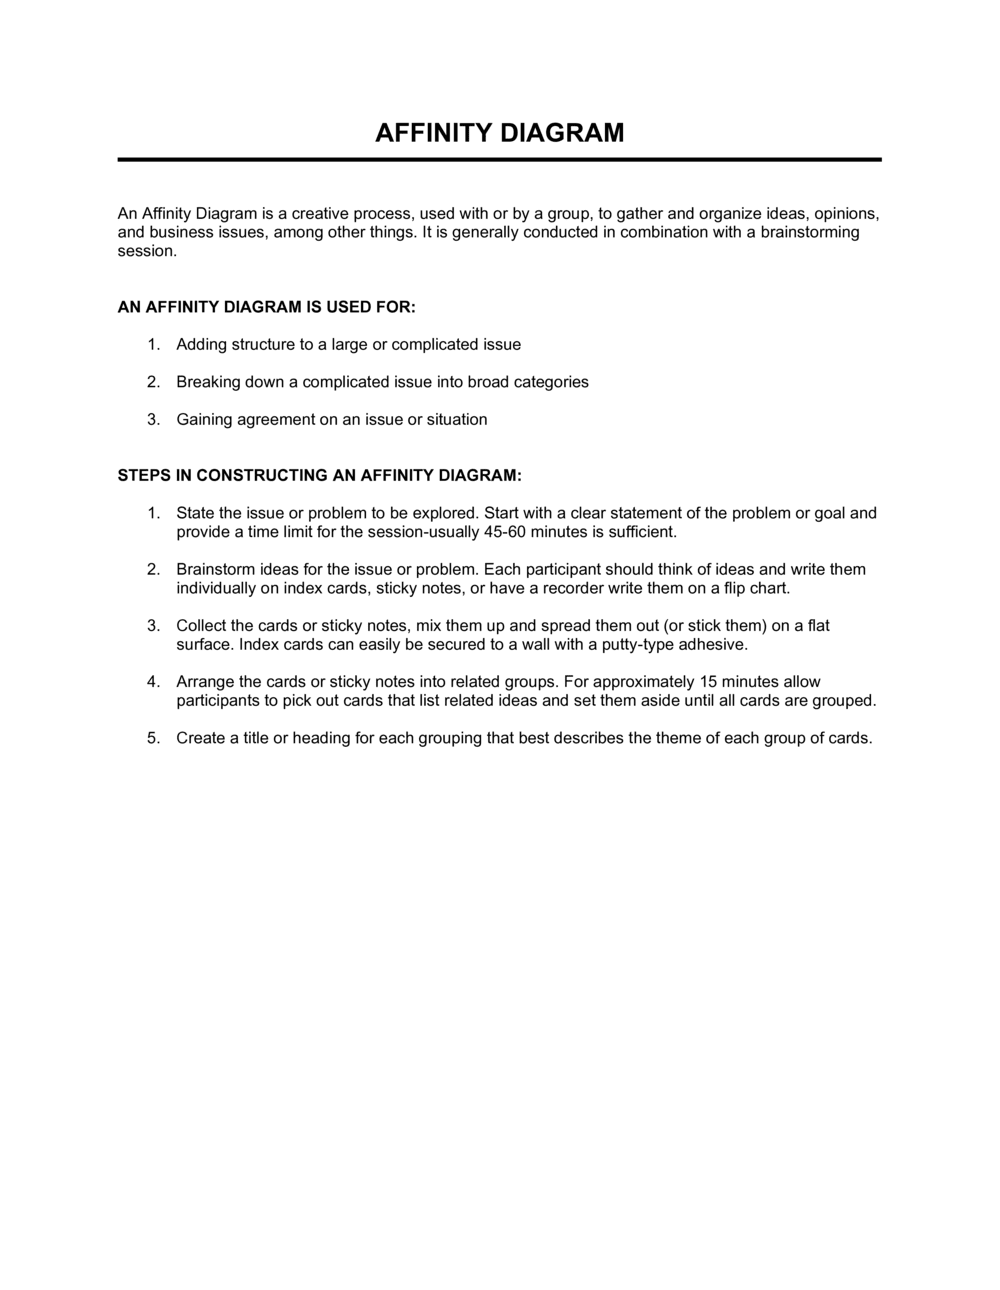
Affinity Diagram Template

Free download β€’ Use as a template β€’ Print or share

4 pagesβ€’20–30 min to useβ€’Difficulty: Standardβ€’Signature requiredβ€’Legal review recommended
Learn more ↓
FreeAffinity Diagram Template

At a glance

What it is
An Affinity Diagram is a structured visual planning document used to organize large volumes of qualitative data β€” observations, ideas, user feedback, or brainstorming notes β€” into labeled thematic clusters. This free Word download gives you a ready-made grid layout you can populate with sticky-note-style entries, group by theme, and export as PDF for presentation or stakeholder review.
When you need it
Use it immediately after a research session, workshop, or brainstorming exercise when you have dozens of raw data points that need to be synthesized into actionable themes. It is especially useful before defining product requirements, writing a project brief, or presenting user research findings to a leadership team.
What's inside
A header block for project context and session metadata, a raw data capture area, a themed grouping grid with labeled cluster columns, a summary findings section, and a recommended next-steps block to carry insights forward into decisions.

What is an Affinity Diagram?

An Affinity Diagram is a structured visual tool used to organize large volumes of qualitative data β€” user quotes, brainstorming notes, research observations, or stakeholder feedback β€” into labeled thematic clusters that reveal patterns and inform decisions. Developed by anthropologist Jiro Kawakita in the 1960s and widely adopted in design thinking, quality management, and product development, the method works by grouping individual data points from the bottom up based on natural affinity rather than imposing a predefined framework. The result is a map of themes that shows what a data set is actually saying, not what the team assumed it would say before the research began.

Why You Need This Document

Without a structured synthesis method, qualitative research data β€” interview recordings, workshop sticky notes, survey verbatims β€” sits in folders and never reaches the decisions it was collected to inform. Teams skip synthesis, present raw quotes to stakeholders, and watch the findings get ignored because the pattern is not visible. An affinity diagram converts that raw material into a ranked set of insight statements with clear implications for action, giving product managers a defensible basis for roadmap decisions, consultants a structured deliverable to present to clients, and operations teams a shared view of where the most significant problems actually live. This template gives you the structure to run the session, capture the output, and present findings in a format stakeholders can read and act on β€” without building the document from scratch after every research cycle.

Which variant fits your situation?

If your situation is…Use this template
Synthesizing findings from multiple user interviewsUX Research Affinity Diagram
Running a team brainstorming or ideation workshopBrainstorming Affinity Map
Organizing a root-cause analysis across a process failureCause and Effect (Fishbone) Diagram
Prioritizing a list of ideas by impact and feasibilityPrioritization Matrix
Capturing and grouping retrospective feedback from a sprintSprint Retrospective Template
Presenting clustered themes to leadership as a formal deliverableResearch Findings Report
Mapping customer journey pain points across touchpointsCustomer Journey Map

Common mistakes to avoid

❌ Grouping data before everyone has contributed

Why it matters: Early sorters anchor the cluster structure, and later participants unconsciously fit their observations into existing groups β€” producing clusters that reflect one perspective rather than the full data set.

Fix: Use silent individual sorting before any group discussion. Review individual groupings side by side before converging on a shared structure.

❌ Writing cluster labels that describe content instead of meaning

Why it matters: Labels like 'User comments about navigation' describe what is in the cluster but tell stakeholders nothing about what it implies or why it matters.

Fix: Write labels that capture the insight: 'Navigation blocks task completion' tells a stakeholder immediately what the cluster means and why it is important.

❌ Discarding data points that do not fit any cluster

Why it matters: Outliers are often the most valuable signals in a data set β€” they can indicate an emerging trend, a population segment you did not plan for, or a gap in your research design.

Fix: Create an explicit 'Outliers and exceptions' column. Review it at the end of the session to determine whether any outlier warrants a new cluster or a follow-up research question.

❌ Ending the session without assigning next steps

Why it matters: An affinity diagram without action items is a completed analysis, not a planning tool. Research that does not connect to a decision or deliverable within two weeks is rarely acted on.

Fix: Reserve the final 15 minutes of every session for the next-steps block. Assign an owner and a due date to each priority finding before anyone leaves the room.

❌ Treating all clusters as equal priority

Why it matters: Presenting eight clusters without ranking forces every stakeholder to decide for themselves what matters most β€” resulting in fragmented follow-up and diluted resources.

Fix: Run a dot-vote or scoring exercise before closing the session. Document the ranked output so that the top three clusters receive focused attention in the next planning cycle.

❌ Combining two observations into one data entry

Why it matters: A dual-observation entry cannot be independently sorted β€” if the two ideas belong in different clusters, you must split the entry or leave one cluster incomplete.

Fix: Apply a strict one-idea-per-entry rule during data capture. If an observation contains two distinct points, write two separate entries before the sorting session begins.

The 9 key clauses, explained

Session header and project context

In plain language: Records the project name, session date, facilitator, participants, and the specific research question or problem the diagram is addressing.

Sample language
Project: [PROJECT NAME] | Session Date: [DATE] | Facilitator: [NAME] | Participants: [LIST] | Research Question: [QUESTION OR PROBLEM STATEMENT]

Common mistake: Omitting the research question from the header. Without it, reviewers who were not in the session cannot evaluate whether the themes answer the right problem.

Raw data capture area

In plain language: The unorganized input zone where all individual observations, quotes, ideas, or data points are recorded before grouping begins β€” one idea per entry.

Sample language
Data Point #[N]: '[VERBATIM QUOTE OR OBSERVATION]' β€” Source: [PARTICIPANT ID / SESSION / DATE]

Common mistake: Combining two observations into one entry. Each entry must represent exactly one idea so it can be independently moved to a different cluster without losing meaning.

Thematic cluster labels

In plain language: The named headers placed above each grouping of related data points β€” concise, action-oriented labels that describe what the cluster means, not just what it contains.

Sample language
Cluster Label: [THEME NAME β€” e.g., 'Onboarding friction', 'Trust and transparency', 'Price sensitivity'] | Data points in this cluster: [N]

Common mistake: Using vague cluster labels like 'Miscellaneous' or 'Other.' Every cluster should have a label specific enough that a stakeholder who was not present can understand what it means.

Data point entries within each cluster

In plain language: The individual observations, quotes, or ideas sorted into each cluster, each tagged with its original source for traceability back to the raw data.

Sample language
β€’ '[USER QUOTE OR OBSERVATION]' β€” [PARTICIPANT ID], [DATE] | β€’ '[SECOND ENTRY]' β€” [SOURCE]

Common mistake: Discarding outlier data points that do not fit any cluster. Outliers often signal an emerging theme or a blind spot in the research design β€” log them in a separate 'exceptions' column.

Cluster summary and insight statement

In plain language: A one-to-two sentence synthesis of what the cluster reveals β€” written as an insight statement that implies a direction for action, not just a description of what was observed.

Sample language
Cluster Insight: Users who [BEHAVIOR] consistently report [PAIN POINT], suggesting that [ROOT CAUSE OR OPPORTUNITY]. This implies [RECOMMENDED DIRECTION].

Common mistake: Writing cluster summaries as descriptions ('People talked about pricing') rather than insights ('Users abandon the checkout flow because the total cost is not visible until the final step').

Priority ranking of clusters

In plain language: A documented record of how the team ranked or voted on clusters by importance, frequency, or urgency β€” typically using dot voting or a scoring rubric.

Sample language
Priority Ranking | Cluster: [NAME] | Votes / Score: [N] | Rationale: [WHY THIS CLUSTER IS HIGHEST PRIORITY]

Common mistake: Skipping the prioritization step and presenting all clusters as equally important. Without ranking, stakeholders cannot allocate attention or resources efficiently.

Cross-cluster connections

In plain language: Notes on relationships or tensions between different clusters β€” where themes overlap, contradict, or reinforce each other β€” to surface systemic patterns.

Sample language
Connection: Cluster [A] and Cluster [B] both reference [SHARED THEME], suggesting [SYSTEMIC ISSUE OR OPPORTUNITY]. Tension: Cluster [C] contradicts Cluster [D] in that [EXPLANATION].

Common mistake: Treating each cluster as fully independent. Real-world problems are systemic; missing cross-cluster connections leads to solutions that address symptoms rather than root causes.

Summary findings section

In plain language: A consolidated view of the top three to five insights drawn from the diagram as a whole β€” written for an audience that will not read the full diagram.

Sample language
Top Findings: 1. [FINDING] β€” supported by [N] data points across [X] clusters. 2. [FINDING] β€” supported by [N] data points. 3. [FINDING] β€” [EVIDENCE].

Common mistake: Listing every cluster in the summary instead of selecting the most significant findings. The summary should be a curated executive view, not a repeat of the full diagram.

Recommended next steps

In plain language: Concrete actions, owners, and timelines derived from the top insights β€” connecting the diagram to a decision or deliverable so the research does not stall.

Sample language
Next Step: [ACTION β€” e.g., 'Define problem statement for Cluster 1 findings'] | Owner: [NAME] | Due: [DATE] | Linked deliverable: [DOCUMENT OR DECISION]

Common mistake: Ending the diagram without next steps. A completed affinity diagram with no action items is an analysis artifact, not a planning tool β€” the research investment goes to waste.

How to fill it out

  1. 1

    Complete the session header before the meeting starts

    Enter the project name, date, facilitator name, participant list, and the specific research question or problem statement the session is designed to address. Distribute to participants in advance so everyone arrives with context.

    πŸ’‘ A clearly stated research question keeps the sorting session focused. If participants disagree on the question, resolve it before touching any data.

  2. 2

    Dump all raw data into the capture area without grouping

    Record every observation, quote, idea, or data point β€” one per row or entry β€” in the raw data capture section. Do not sort or evaluate yet. Include the source reference for every entry.

    πŸ’‘ Aim for 50–150 data points for a meaningful session. Fewer than 30 rarely produces distinct themes; more than 200 becomes unmanageable without digital tooling.

  3. 3

    Sort data points into clusters silently

    Have participants independently move data entries into groups they see as related, without discussion. Silent sorting reduces groupthink and surfaces diverse perspectives before consensus is sought.

    πŸ’‘ Set a timer for 10–15 minutes for silent sorting. Interrupting early convergence catches groupings that reflect one person's mental model rather than the data's natural structure.

  4. 4

    Label each cluster with a specific, action-oriented name

    Once sorting is complete, the group collaboratively names each cluster. Labels should describe what the cluster means and imply a direction β€” not just describe the contents.

    πŸ’‘ If you cannot write a label in five words or fewer, the cluster may be too broad. Split it into two narrower clusters and relabel.

  5. 5

    Write an insight statement for each cluster

    For each cluster, draft one to two sentences that synthesize what the group of data points reveals. Frame the insight as an observation about behavior, context, or need β€” not a list of features.

    πŸ’‘ A strong insight statement uses the format: '[User/stakeholder group] [behavior or experience] because [underlying reason], which means [implication for action].'

  6. 6

    Note cross-cluster connections and tensions

    Review all clusters together and draw explicit connections where themes overlap or contradict. Document these in the cross-cluster connections section.

    πŸ’‘ Connections between clusters often reveal the systemic root cause that individual clusters only hint at β€” these are frequently the most valuable findings in the diagram.

  7. 7

    Prioritize clusters using dot voting or a scoring rubric

    Give each participant three to five votes to allocate across clusters based on importance to the research question. Record the vote totals and the rationale for the top-ranked clusters.

    πŸ’‘ Use frequency (how many data points) plus severity (how much the issue matters) as two separate scoring axes if dot voting alone feels too subjective.

  8. 8

    Write the summary findings and assign next steps

    Distill the top three to five insights into the summary section, then define one concrete next step per priority finding with an owner and a due date.

    πŸ’‘ Present the summary findings within 48 hours of the session while context is fresh. Diagrams that sit unpresented for more than a week lose stakeholder momentum.

Frequently asked questions

What is an affinity diagram?

An affinity diagram is a structured method for organizing large volumes of qualitative data β€” observations, ideas, user quotes, or brainstorming outputs β€” into labeled thematic clusters. Developed by Japanese anthropologist Jiro Kawakita in the 1960s (sometimes called a KJ diagram), it is widely used in UX research, product planning, quality management, and organizational problem-solving to surface patterns in unstructured data and connect research to decisions.

When should I use an affinity diagram?

Use an affinity diagram immediately after generating a large set of qualitative data that needs to be synthesized β€” user interviews, customer surveys, usability tests, team retrospectives, or brainstorming workshops. It is most valuable when you have 30 or more individual data points, multiple contributors, and a need to present findings to a stakeholder audience that was not present during data collection.

What is the difference between an affinity diagram and a mind map?

A mind map starts from a central idea and branches outward hierarchically β€” it is a top-down tool for structuring known information. An affinity diagram starts from raw, unordered data and builds clusters from the bottom up by grouping what naturally belongs together. Mind maps organize what you already know; affinity diagrams help you discover patterns in data you have not yet interpreted.

How many clusters should an affinity diagram have?

Most sessions produce between four and ten meaningful clusters. Fewer than four suggests the data is too sparse or the grouping was too broad; more than twelve clusters usually means the grouping was too granular and should be consolidated. If you end up with more than ten clusters, look for second-level groupings β€” clusters of clusters β€” to reduce cognitive load when presenting findings.

Can an affinity diagram be created digitally?

Yes. Digital affinity diagrams work well with tools like Miro, FigJam, or Notion for remote or hybrid teams. The Business in a Box Word template provides a structured document format that is ideal for formal deliverables, stakeholder reports, and situations where a grid-based document is more appropriate than a whiteboard export. Both formats produce the same output β€” the choice depends on your team's workflow and the audience for the deliverable.

How many data points do I need to run an affinity diagram session?

A practical minimum is 30 individual data points; sessions with 50–150 entries tend to produce the most distinct and meaningful clusters. Below 30, patterns are hard to distinguish from noise. Above 200, the sorting process becomes unwieldy without digital tooling or a structured sub-grouping approach. If your data set is very large, run the session in two rounds β€” first clustering within topic areas, then clustering across them.

Who should participate in an affinity diagramming session?

The most effective sessions include the researchers or observers who collected the data plus two to four stakeholders from different functions β€” design, product, engineering, or business. Cross-functional participation reduces interpretation bias and produces clusters that reflect multiple perspectives. Limit sessions to eight or fewer participants; larger groups slow consensus and create social dynamics that suppress minority viewpoints.

How long does an affinity diagram session take?

A standard session with 60–100 data points and four to six participants runs 90 minutes to two hours: roughly 10 minutes for setup and context, 15 minutes for silent sorting, 20–30 minutes for collaborative grouping and labeling, 20 minutes for insight statements, and 15 minutes for prioritization and next steps. Budget an additional hour after the session to produce the written summary findings document.

How is an affinity diagram different from a fishbone (Ishikawa) diagram?

A fishbone diagram is specifically designed to trace a known problem back to its root causes, organized along predefined cause categories such as people, process, equipment, and environment. An affinity diagram is open-ended β€” it does not assume categories in advance and is used to discover themes rather than diagnose a specific failure. Use a fishbone diagram when you know the problem and need to find its cause; use an affinity diagram when you need to understand what problems exist.

How this compares to alternatives

vs Fishbone (Cause and Effect) Diagram

A fishbone diagram traces a single known problem to its root causes along predefined category branches. An affinity diagram is open-ended β€” it discovers what themes exist across a large unstructured data set without assuming categories in advance. Use a fishbone diagram when the problem is already defined; use an affinity diagram when you are still discovering what the problems are.

vs SWOT Analysis

A SWOT analysis organizes information into four fixed quadrants β€” strengths, weaknesses, opportunities, threats β€” using a predefined framework. An affinity diagram creates its categories from the data itself, making it more appropriate for open-ended research synthesis. SWOT is best for strategic situation assessment; affinity diagrams are best for qualitative research synthesis where the themes are not known in advance.

vs Prioritization Matrix

A prioritization matrix evaluates a list of already-identified options against scoring criteria such as impact and effort. An affinity diagram is used earlier in the process to discover and group the themes from which that list is built. These two tools are complementary: run an affinity diagram to identify the options, then use a prioritization matrix to rank them.

vs Mind Map

A mind map structures known information hierarchically from a central concept outward β€” it is a top-down organization tool. An affinity diagram builds structure bottom-up from raw, unordered data by grouping what naturally belongs together. Use a mind map when you want to organize and communicate existing knowledge; use an affinity diagram when you need to find patterns in data you have not yet interpreted.

Industry-specific considerations

Technology / SaaS

Used after user interviews and usability tests to group feedback into product themes that feed directly into sprint planning and roadmap decisions.

Healthcare

Applied in patient experience research and clinical process improvement workshops to cluster staff observations and patient feedback into care-quality themes.

Professional Services

Consultants use affinity diagrams to synthesize client workshop outputs into themed recommendations delivered as part of a formal engagement report.

Retail / E-commerce

Clusters customer complaint data, return reasons, and support-ticket themes to prioritize product improvements and customer experience investments.

Financial Services

Groups regulatory feedback, audit findings, and compliance observations into thematic risk areas to prioritize remediation efforts.

Education

Faculty and instructional designers use affinity diagrams to organize student feedback and learning-outcome observations into curriculum improvement priorities.

Jurisdictional notes

United States

Affinity diagrams are internal planning and research documents with no jurisdiction-specific legal requirements in the US. When used as part of a formal UX research deliverable in a regulated industry β€” such as healthcare or financial services β€” ensure that any participant data captured in the diagram is handled in accordance with applicable privacy laws, including HIPAA for health information and applicable state privacy statutes.

Canada

Affinity diagrams used to synthesize participant data collected during user research should comply with PIPEDA or applicable provincial privacy legislation when personal information is included in data entries. In Quebec, Law 25 imposes additional obligations on how personal data is collected, stored, and shared β€” ensure that raw data entries are anonymized before the diagram is distributed beyond the core research team.

United Kingdom

When an affinity diagram captures personally identifiable information from research participants, it is subject to UK GDPR requirements. Raw participant quotes used as data entries should be anonymized at the point of capture or before the document is shared with stakeholders outside the immediate research team. Retain participant consent records separately from the diagram itself.

European Union

EU GDPR applies when affinity diagrams contain personal data from research participants. Data minimization principles require that only the information necessary for the research purpose be included in data entries. Member states may impose additional requirements β€” Germany and France, for example, have national data protection authorities that have issued specific guidance on research data handling. Anonymize or pseudonymize participant data before sharing diagrams outside the research team.

Template vs lawyer β€” what fits your deal?

PathBest forCostTime
Use the templateIndividual researchers, small product or design teams running internal synthesis sessionsFree90 minutes to 2 hours per session
Template + legal reviewConsultants producing affinity diagram deliverables for client engagements or formal research reports$100–$500 for a facilitator or research specialist reviewHalf day including session and report
Custom draftedEnterprise research operations teams needing a standardized template system integrated with project management and documentation workflows$500–$2,000 for custom facilitation and documentation design1–5 days

Glossary

Affinity Diagram
A tool for grouping large sets of qualitative data β€” ideas, observations, or feedback β€” into natural thematic clusters to reveal patterns.
Affinity Mapping
The facilitated process of sorting individual data points into groups, typically done collaboratively using sticky notes or a digital equivalent.
Theme / Cluster
A labeled group of related data points that share a common characteristic, insight, or problem area identified during the sorting process.
Qualitative Data
Non-numerical research data β€” quotes, observations, and descriptions β€” that captures context, behavior, and meaning rather than frequency or scale.
Synthesis
The process of combining raw research findings into higher-level insights, patterns, or themes that can inform decisions.
Insight Statement
A one-sentence declaration that captures a pattern observed across multiple data points and implies a direction for action or design.
Facilitator
The person who guides the affinity mapping session β€” defining rules, keeping the group moving, and ensuring all voices contribute to the sorting process.
Dot Voting
A rapid group decision technique where participants place a limited number of dot stickers on their preferred items to surface collective priorities.
Saturation
The point in qualitative research at which new data points stop generating new themes β€” a signal that enough data has been collected.
How Might We (HMW)
A question format used to reframe a problem cluster as a design opportunity: 'How might we [verb] [outcome] for [user]?'
Silent Sorting
An affinity mapping technique where participants group data points independently and without discussion to reduce groupthink before a collective review.

Part of your Business Operating System

This document is one of 3,000+ business & legal templates included in Business in a Box.

  • Fill-in-the-blanks β€” ready in minutes
  • 100% customizable Word document
  • Compatible with all office suites
  • Export to PDF and share electronically

Create your document in 3 simple steps.

From template to signed document β€” all inside one Business Operating System.
1
Download or open template

Access over 3,000+ business and legal templates for any business task, project or initiative.

2
Edit and fill in the blanks with AI

Customize your ready-made business document template and save it in the cloud.

3
Save, Share, Send, Sign

Share your files and folders with your team. Create a space of seamless collaboration.

Save time, save money, and create top-quality documents.

β˜…β˜…β˜…β˜…β˜…

"Fantastic value! I'm not sure how I'd do without it. It's worth its weight in gold and paid back for itself many times."

Managing Director Β· Mall Farm
Robert Whalley
Managing Director, Mall Farm Proprietary Limited
β˜…β˜…β˜…β˜…β˜…

"I have been using Business in a Box for years. It has been the most useful source of templates I have encountered. I recommend it to anyone."

Business Owner Β· 4+ years
Dr Michael John Freestone
Business Owner
β˜…β˜…β˜…β˜…β˜…

"It has been a life saver so many times I have lost count. Business in a Box has saved me so much time and as you know, time is money."

Owner Β· Upstate Web
David G. Moore Jr.
Owner, Upstate Web

Run your business with a system β€” not scattered tools

Stop downloading documents. Start operating with clarity. Business in a Box gives you the Business Operating System used by over 250,000 companies worldwide to structure, run, and grow their business.

Free Forever PlanΒ Β·Β No credit card required