1
Complete the company overview with your regulatory identifiers
Enter your legal entity name, formation state, founding date, home terminal address, DOT number, and MC authority number. If you are pre-authority, note the application status and expected issuance date.
💡 Lenders pull your FMCSA safety rating and authority status before reading the rest of the plan — make sure these match your official FMCSA profile exactly.
2
Define your service type and primary freight lanes
Choose your service model (TL, LTL, dedicated, or specialized) and list your top two to four freight lanes with origin city, destination city, approximate miles, load frequency per week, and average rate per mile.
💡 Use DAT or Truckstop.com load board data to support your lane rate assumptions — citing a real source adds credibility to your revenue model.
3
Build your market analysis around regional lane data
Pull regional market size data from the American Trucking Associations, ATRI, or IBISWorld, then narrow to your specific commodity and corridor. Identify the top three to five shipper types you will target and their typical monthly load volume.
💡 A single paragraph with a real lane rate citation ($X.XX/mile on [LANE], source: DAT Q[X] [YEAR]) is more persuasive to lenders than three paragraphs of national industry statistics.
4
Map your fleet and operations model
List every truck and trailer — year, make, model, VIN if available, owned or financed, current mileage, and scheduled maintenance intervals. Include your ELD provider, dispatch software, and driver classification (company, lease-op, or owner-op).
💡 State your target driver-to-truck ratio and your driver pay model (cents per mile, percentage, or salary) — this directly affects your CPM calculation and is one of the first things a fleet lender checks.
5
Build per-truck unit economics before projecting revenue
Calculate your revenue per mile and cost per mile for a single average truck. Break CPM into six components: fuel, driver compensation, maintenance and tires, insurance, truck/trailer payment, and overhead allocation. Then multiply by fleet size and annual utilization miles.
💡 A realistic utilization rate for a long-haul truck is 100,000–120,000 loaded miles per year. Using 130,000+ without justification flags the model as overly optimistic to experienced lenders.
6
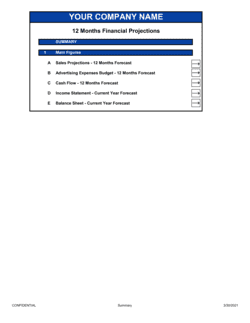
Complete the three-statement financial model
Build a monthly P&L for Year 1 and annual statements for Years 2–3. Derive the cash flow statement from the P&L — pay particular attention to factoring fees, fuel card cycles, and driver pay timing. Close the balance sheet to confirm ending cash matches.
💡 Include a 90-day operating cash reserve assumption in your working capital line — fuel and driver payroll hit before many shippers pay, and lenders expect to see this bridge funded.
7
State the funding ask with asset-level detail
Separate your request into hard-asset financing (trucks and trailers with individual cost per unit) and working capital. Note the preferred instrument for each — equipment loan, SBA 7(a), or SBA 504 — and the collateral you are offering.
💡 Including a simple table showing truck cost, down payment, loan amount, and monthly payment per unit makes it easier for a lender to structure the deal and significantly speeds up approval.
8
Write the executive summary last
Pull the most compelling data points from each section — fleet size, target lanes, Year 1 revenue, operating ratio, and funding ask — and compress them into one to two pages. The summary should make a lender want to read the full plan.
💡 Mention your safety rating or CSA scores if they are strong — a low CSA score is a competitive differentiator that most plans omit.