Reporting & Analytics
Business Intelligence That Comes From Your Actual Work Data
Stop exporting spreadsheets and building reports from scratch. Business in a Box generates real-time reports on project health, team performance, KPIs, and time data — straight from the work happening in your OS.
The Problem
Your Data Is Everywhere. Your Reports Tell You Nothing Useful.
Most businesses have plenty of data — they just can't access it when it matters. Project status lives in Asana. Time data lives in Toggl. Sales numbers are in the CRM. HR metrics are in BambooHR. Getting a complete picture of your business means exporting CSVs from five platforms, stitching them together in Excel, and presenting a report that's already outdated by the time it's done.
Leaders end up making decisions based on gut feel because getting real data takes too long. By the time the report is ready, the window for action has passed. Business in a Box collects data across every function — tasks, time, people, projects, finances — and surfaces it as live reports the moment you need them.
How It Works
Live Reports Generated From Your Business Data
Because Business in a Box runs your tasks, time, people, and projects in one platform, it can generate reports that no external BI tool can match — without any data stitching.
Executive Dashboard
One View of Your Whole Business
See project health, team utilization, revenue pipeline, and KPIs on a single executive dashboard. Updated in real time — no manual refresh required.
Project Reports
Know Exactly Where Every Project Stands
Task completion rates, milestone progress, budget burn, and time logged — all in one project report. Spot delays before they become missed deadlines.
Time & Utilization
See How Your Team's Time Is Actually Spent
Real-time utilization reports show hours logged by person, project, and client. Identify overloaded team members and underperforming time allocations instantly.
Team Performance
Track Individual and Team Output
Task completion velocity, on-time delivery rates, and workload distribution reports give managers an objective view of team performance without micromanaging.
KPI Tracking
Define, Track, and Report on Any KPI
Set business KPIs and track them against real data from your OS. Revenue per employee, project margins, customer response time — any metric, live.
Export & Share
Share Reports in Any Format
Export reports as PDF, CSV, or share live dashboard links with stakeholders. Schedule automated report delivery to leadership without lifting a finger.

A Day in the Life
How Reporting Works Inside Business in a Box
From morning check-ins to board-level presentations, live reporting gives every stakeholder the data they need without anyone spending hours building it.
Use Cases
Who Uses Reporting & Analytics in Business in a Box
Leaders, managers, and finance teams across every business function rely on live reporting to make faster, smarter decisions.
Leadership
Run the Business From One Executive Dashboard
CEOs and COOs get a real-time view of project health, team performance, and financial KPIs without waiting for weekly status meetings or manual reports.
Project Management
Catch Project Problems Before They Become Crises
Project managers track task velocity, milestone progress, and budget burn in real time — spotting risks early and acting before deadlines are missed.
Finance
Generate Accurate Time-and-Billing Reports Instantly
Finance teams pull billable hours by client, project, and employee from live data. Invoicing becomes a click, not a reconciliation exercise.
HR & People Ops
Monitor Team Utilization and Prevent Burnout
HR leaders see utilization rates, workload distribution, and headcount reports that help them staff projects appropriately and catch overwork before it causes turnover.
Connected OS
Reports Powered by Every Part of Your Business OS
Reporting in Business in a Box is only possible because tasks, time, people, and projects all live in one platform — giving you a data layer no external BI tool can replicate.
Task Management
Task completion rates, velocity, and on-time delivery feed directly into team and project performance reports.
Time Tracking
Logged hours power utilization, profitability, and time-and-billing reports without any manual data entry.
HR & People
Headcount, role, and department data feed into staffing, utilization, and performance analytics.
Projects
Project status, milestones, and budgets roll up into executive dashboards and client-facing reports automatically.
CRM & Sales
Deal pipeline, win rates, and revenue forecasts power sales analytics and financial KPI dashboards.
Ready-to-Use Templates
Report Templates for Every Business Function
Pre-built report frameworks for project status, financial performance, team productivity, and executive dashboards — ready to populate with your data.
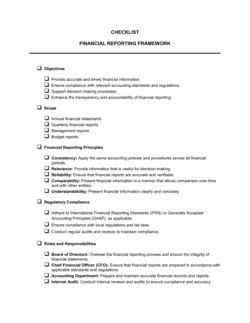
Each template is designed to help you move faster while giving your business more structure and consistency.
Browse All 3,000+ TemplatesPart of the Platform
Reporting & Analytics Is Just One Part ofthe Operating System
Business in a Box connects reporting & analytics to everything else your business needs to run.
Tasks & Projects
Plan, assign, and track tasks with full project management.
Docs & Knowledge
Organize policies, procedures, and business documents in one place.
Chat & Calls
Communicate with your team without switching apps.
Dashboard
See all data, project progress, and team performance in one view.
HR & People
Manage employees, attendance, and payroll-ready timesheets.
Ratings & Reviews
Rated Highly by Businesses Worldwide
What Businesses Say
Trusted by 250,000+ Businesses Worldwide
“I used to spend half of Sunday building the Monday morning report for our leadership team. Now I send them a live dashboard link and the data is always current. It's saved me 4 hours every single week.”
Rachel Obi — Director of Operations, Clearwater Group
“We caught a $40,000 budget overrun three weeks early because the project report flagged it automatically. That would have been invisible until the invoice arrived under our old system.”
Nathan Graves — CFO, Verified Business
“The utilization reports changed how we staff projects. We can see who's overloaded in real time and reassign before anyone burns out. Our project delivery rate jumped 22% in the first quarter.”
Anita Krishnamurthy — VP of Delivery, Novex Consulting
Enterprise-Ready Security
Built for Trust, Security, and Compliance
Your data is protected by enterprise-grade infrastructure and compliance standards.


Questions
Frequently Asked Questions


Stop Building Reports. Start Making Decisions.
Live business intelligence generated from the work happening in your OS — no spreadsheets, no CSV exports, no stale data.
14-day money-back guarantee · Set up in minutes · Cancel anytime