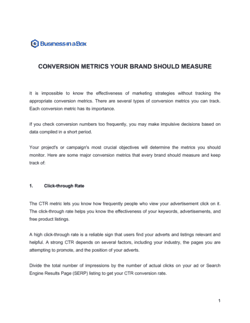
How To Optimize Conversion Rate

Free to read • Save or share with one click

FreeHow To Optimize Conversion Rate Template

At a glance

What it is
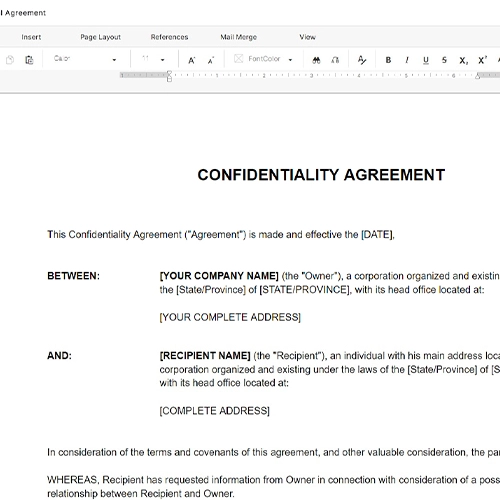
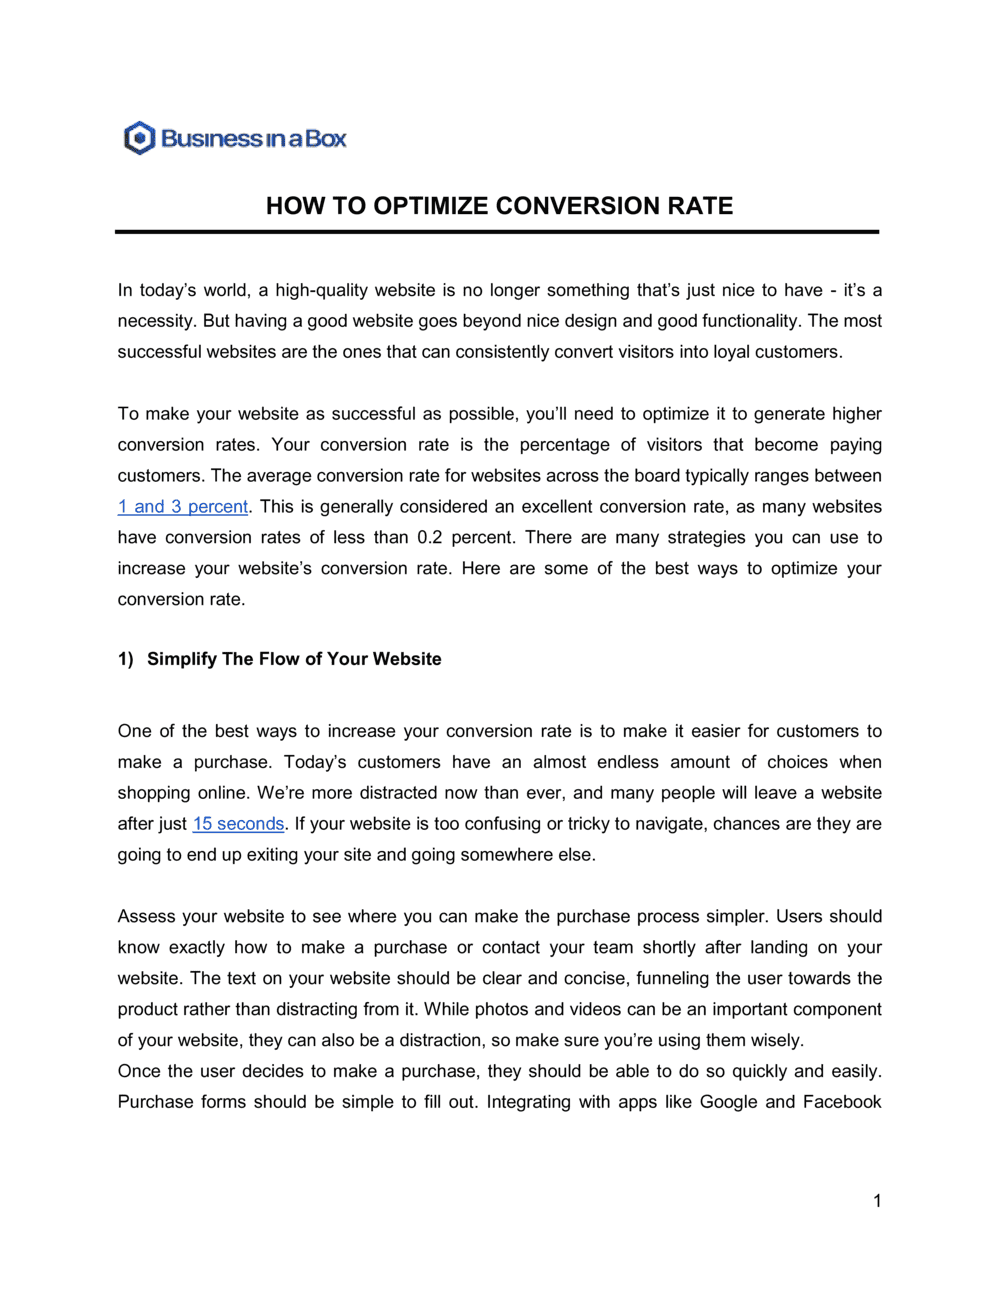
A How To Optimize Conversion Rate guide is a structured operational document that walks a business through every stage of improving the percentage of visitors, leads, or prospects who complete a target action — from purchase to sign-up to form submission. This free Word download gives you a ready-to-edit framework covering funnel diagnosis, hypothesis generation, A/B testing, UX improvements, and performance tracking that you can export as PDF and share with your marketing or product team.
When you need it
Use it when traffic is healthy but revenue or sign-ups are not keeping pace, when a new landing page or checkout flow is underperforming, or when leadership needs a documented CRO process rather than ad hoc experimentation. It is equally valuable before a product launch, a paid-media scale-up, or a quarterly growth review.
What's inside
Funnel mapping and baseline metrics, qualitative and quantitative research methods, hypothesis prioritization framework, A/B and multivariate testing protocols, UX and copy optimization guidelines, post-test analysis, and a rolling experimentation calendar. Each section includes worked examples with placeholder data you replace with your own.

What is a How To Optimize Conversion Rate guide?

A How To Optimize Conversion Rate guide is a structured operational document that maps a repeatable process for diagnosing why visitors are not converting and systematically improving that rate through evidence-based experimentation. It covers every stage of the conversion optimization cycle: establishing a quantitative baseline across funnel steps, gathering qualitative user research to understand the real reasons for drop-off, generating and prioritizing testable hypotheses, designing statistically valid A/B tests, and documenting results in a shared knowledge base that compounds learning over time. Unlike a general marketing plan, this guide is narrowly focused on the mechanics of turning existing traffic into more revenue, leads, or sign-ups without increasing ad spend.

Why You Need This Document

Without a structured CRO process, most businesses make page changes based on opinion rather than evidence — shipping redesigns that feel better but move conversion rates in the wrong direction, or running A/B tests that are stopped too early, contaminated by overlapping experiments, or never documented for future reference. The cost is measurable: a site converting at 2% that reaches 3% through disciplined optimization generates 50% more revenue from identical traffic spend. A documented CRO guide replaces ad hoc guesswork with a repeatable system — one that accumulates institutional knowledge with every test, regardless of whether that test wins or loses. This template gives your team the framework to run that system from day one, without building the process from scratch.

Which variant fits your situation?

If your situation is…Use this template
Optimizing a single landing page for a paid campaignLanding Page Optimization Checklist
Reducing cart abandonment in an e-commerce storeE-Commerce Conversion Optimization Plan
Improving SaaS free-trial-to-paid conversionSaaS Onboarding Optimization Guide
Presenting CRO findings and recommendations to leadershipMarketing Performance Report
Planning a full digital marketing strategy with CRO as one componentDigital Marketing Plan
Auditing a website's UX before a redesignWebsite Audit Report
Running a structured A/B testing program at scaleA/B Testing Plan Template

Common mistakes to avoid

❌ Testing without a user-research foundation

Why it matters: Hypotheses based on best practices or competitor copying have a low win rate because they ignore the specific objections and friction points of your actual users. Most A/B tests designed without qualitative input lose or show no effect.

Fix: Run at minimum an on-exit survey and 30 session recordings before generating a single hypothesis. Every test brief should cite a specific user observation as its evidence base.

❌ Stopping tests early based on promising interim results

Why it matters: Peeking at results before the required sample size is reached dramatically inflates the false-positive rate — published research puts it at 25–40% for tests stopped early — meaning winning variants are often shipped with no real lift.

Fix: Set the required sample size and minimum test duration before launch and enforce a policy that no test is called until both thresholds are met, regardless of how good the interim numbers look.

❌ Running concurrent tests on the same funnel step

Why it matters: When two tests run simultaneously on the same page, users in one test can be exposed to the other variant, contaminating both data sets. A result that appears significant may be entirely an artifact of the overlap.

Fix: Use your testing platform's mutual exclusion or traffic allocation settings to ensure users are assigned to only one test at a time on any given page. If traffic is limited, run tests sequentially rather than in parallel.

❌ Ignoring mobile and desktop as separate optimization problems

Why it matters: A layout change that lifts desktop CVR by 8% can simultaneously drop mobile CVR by 12% if the design does not account for touch targets, viewport size, and scroll behavior — resulting in a net revenue loss when applied site-wide.

Fix: Always segment test results by device type before declaring a winner. If the mobile and desktop effects diverge by more than a few percentage points, ship the variant only to the device where it wins and run a separate mobile-specific test.

The 9 key sections, explained

Baseline metrics and funnel mapping

Qualitative research

Quantitative analysis

Hypothesis prioritization (ICE framework)

A/B test design and execution

UX and copy optimization guidelines

Post-test analysis and documentation

Personalization and segmentation opportunities

Experimentation calendar and velocity targets

How to fill it out

  1. 1

    Populate the baseline metrics table

    Pull conversion rate data for each funnel stage from your analytics platform — Google Analytics 4, Adobe Analytics, or equivalent. Enter the current date as the baseline snapshot date so future comparisons are time-anchored.

    💡 Export a 90-day rolling average rather than a single month. Monthly rates fluctuate with seasonality and campaign spend, making them unreliable baselines.

  2. 2

    Run qualitative research before touching the template

    Set up a five-question on-exit survey and review at least 50 session recordings before completing the qualitative section. Record the most common objections and confusions verbatim in the research findings block.

    💡 The single most valuable exit-survey question is open-ended: 'What almost stopped you from completing this today?' — the responses consistently surface the highest-impact hypotheses.

  3. 3

    Segment quantitative data by device and source

    Break down your funnel metrics by mobile vs. desktop and by traffic source (paid, organic, email, direct). Enter each segment's conversion rate in the quantitative analysis table and calculate the revenue gap for the worst-performing segment.

    💡 Sort segments by session volume × CVR gap — the product of those two numbers tells you which segment has the most recoverable revenue.

  4. 4

    Score and rank hypotheses using the ICE framework

    List every potential change identified in your research. Score each on Impact (1–10), Confidence (1–10), and Ease (1–10), calculate the average ICE score, and sort the backlog from highest to lowest. The top five become your first testing quarter.

    💡 Keep Ease scores honest — underestimating development effort is the single most common reason testing calendars slip.

  5. 5

    Design each test with a pre-calculated sample size

    Use a sample size calculator (Optimizely, VWO, or Evan Miller's free tool) to determine how many visitors per variant you need at your current traffic level and minimum detectable effect before each test reaches statistical significance.

    💡 If your current traffic requires more than 30 days to reach significance at a 5% MDE, either increase the MDE threshold or consolidate low-traffic pages before testing.

  6. 6

    Document every test result, including losses

    Complete the post-test analysis block for every experiment regardless of outcome. Record the observed lift, confidence level, secondary metric effects, and a one-paragraph explanation of why you believe the result occurred.

    💡 Store completed test records in a shared folder and reference them before building new hypotheses — teams that skip this step routinely re-test ideas that have already been disproved.

  7. 7

    Update the experimentation calendar monthly

    Review the 90-day calendar at the start of each month. Move completed tests to a log, promote the next backlog item, assign an owner and launch date, and check that no two live tests overlap on the same page or funnel step.

    💡 A consistent rhythm of four to six tests per month is more valuable than sporadic bursts of twelve — velocity compounds learning faster than intensity.

Frequently asked questions

What is conversion rate optimization?

Conversion rate optimization (CRO) is the practice of increasing the percentage of visitors who complete a target action — such as a purchase, sign-up, or form submission — without increasing traffic. It combines quantitative analysis of funnel data with qualitative user research to generate hypotheses, which are then validated through controlled A/B or multivariate tests. The goal is to extract more revenue and leads from existing traffic rather than spending more to acquire new visitors.

What is a good conversion rate?

Conversion rates vary significantly by industry, channel, and action type. E-commerce sites typically convert 1–4% of sessions to purchase; B2B lead forms average 2–5%; SaaS free-trial pages commonly see 3–8%. Rather than benchmarking against industry averages, a more actionable approach is to measure your own funnel stage by stage and focus on closing the largest observed gaps — a 30% improvement on your current rate is almost always more achievable than reaching an industry benchmark that applies to a different customer mix and traffic source.

How long does an A/B test need to run?

An A/B test should run until it reaches the pre-calculated sample size at each variant and a minimum of one full business cycle — typically at least 7 days to account for day-of-week behavioral variation, and usually 14–21 days for most sites. The required sample size depends on your current conversion rate, the minimum detectable effect you care about, and the statistical power threshold (typically 80%) you set before the test launches. Sites with fewer than 1,000 monthly conversions often lack the traffic to run reliable A/B tests on anything smaller than a major page redesign.

What tools are commonly used for conversion rate optimization?

The standard CRO stack includes an analytics platform (Google Analytics 4 or Adobe Analytics) for funnel data, a heatmap and session recording tool (Hotjar, Microsoft Clarity, or FullStory) for qualitative insight, a survey tool (Typeform or Hotjar Surveys) for user feedback, and an experimentation platform (Optimizely, VWO, or Google Optimize successor) for A/B testing. For most small and mid-size businesses, Microsoft Clarity (free) plus GA4 plus a basic testing tool covers the full workflow at minimal cost.

What is the ICE framework for prioritizing CRO tests?

ICE stands for Impact, Confidence, and Ease — three dimensions scored 1–10 for each hypothesis. Impact estimates how much the change will move the primary conversion metric if it wins. Confidence reflects how strongly user research or prior test data supports the hypothesis. Ease captures how quickly and cheaply the variant can be built and launched. The average of the three scores ranks your testing backlog. ICE is a fast heuristic, not a precise calculation — the value is forcing explicit reasoning about each dimension before committing developer time.

Should I focus on landing pages or checkout pages first?

Focus first on the funnel stage with the highest drop-off rate multiplied by the highest session volume — that product identifies where the most revenue is leaking. For most e-commerce businesses, checkout abandonment (average industry rate: ~70%) is the single highest-leverage starting point. For lead-generation businesses, the landing page headline and primary CTA typically drive the largest lift. Run a stage-by-stage funnel analysis before deciding — assumptions about where the problem is are frequently wrong.

What is the difference between CRO and UX design?

UX design is concerned with the overall usability, accessibility, and satisfaction of a product or website. CRO is a narrower discipline focused specifically on increasing a measurable conversion metric through evidence-based experimentation. Good UX generally supports CRO, but the two are not the same — a beautifully designed page can still have low conversion rates due to message mismatch, weak social proof, or a confusing value proposition. CRO uses UX improvements as one lever among many, validated through data rather than design intuition alone.

How many tests should a team run per month?

A consistent velocity of four to six completed tests per month is a realistic target for a dedicated CRO practitioner with developer support. Teams new to structured experimentation typically start at one to two tests per month while building research and design workflows. Velocity matters less than quality — a poorly designed test that reaches significance teaches you nothing useful. Prioritize the discipline of proper hypothesis documentation, sample size calculation, and result analysis over raw test count.

Can conversion rate optimization work for B2B businesses?

Yes, though the metrics and levers differ from B2C. B2B CRO typically focuses on lead form completion rates, demo request conversions, and content download rates rather than purchase CVR. The sales cycle is longer, meaning a conversion on the website is usually a micro-conversion (MQL) rather than revenue. B2B CRO also benefits heavily from message clarity — ensuring the page communicates specific outcomes for a defined buyer role — and from social proof tailored to the target industry, such as named customer logos and ROI case studies.

How this compares to alternatives

vs Digital Marketing Plan

A digital marketing plan covers the full spectrum of online channels — SEO, paid media, email, social, and content — and is primarily concerned with driving traffic and brand awareness. A conversion rate optimization guide picks up where the marketing plan stops: once traffic is arriving, CRO focuses exclusively on improving the percentage that converts. The two documents complement each other and are typically used together.

vs Marketing Report

A marketing report documents historical campaign performance across channels and is primarily a backward-looking accountability tool. A CRO optimization guide is forward-looking and action-oriented — it uses current performance data to generate testable hypotheses and a structured experimentation roadmap. Marketing reports may surface a conversion problem; the CRO guide is the plan for solving it.

vs Marketing Plan

A marketing plan defines target audiences, messaging, budget allocation, and channel strategy for a given period. It does not prescribe how to optimize the conversion performance of individual pages or funnels. CRO is a specialized operational discipline that sits within the broader marketing plan as a distinct workstream, requiring its own research methodology, testing infrastructure, and performance tracking.

vs Product Launch Plan

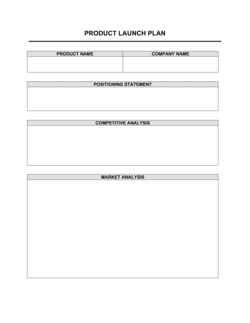
A product launch plan coordinates the go-to-market activities required to bring a new product to market — positioning, pricing, channel activation, and launch timing. A CRO guide becomes relevant after launch, when real user behavior data is available to diagnose why conversion rates are below target and guide iterative improvement. Using a CRO guide before a launch to optimize pre-launch landing pages and lead capture is also a common application.

Industry-specific considerations

E-commerce and retail

Checkout flow optimization, cart abandonment recovery, product page CTA testing, and free-shipping threshold messaging are the highest-impact CRO levers in this sector.

SaaS and technology

Free-trial-to-paid activation rates, onboarding flow completion, and pricing page conversion are the primary CRO focus areas, with in-app micro-conversion tracking essential to diagnosing drop-off.

Professional services

Lead form length, trust signal placement (certifications, client logos, case study links), and consultation booking page copy drive the largest conversion improvements for service-based businesses.

Healthcare and wellness

Appointment booking completion rates, patient intake form abandonment, and privacy-reassurance messaging near form fields are the primary CRO opportunities, with regulatory constraints limiting certain personalization tactics.

Template vs pro — what fits your needs?

PathBest forCostTime
Use the templateIn-house marketers, growth teams, and small business owners running their own experimentation programFree3–5 hours to complete the initial audit and populate the first testing quarter
Template + professional reviewTeams that need a CRO specialist to validate their hypothesis backlog or interpret ambiguous test results$500–$2,000 for a CRO consultant review session1–2 weeks
Custom draftedEnterprise sites with complex multi-step funnels, regulated industries, or businesses investing $50K+ per month in paid traffic$5,000–$20,000+ for a full CRO agency engagement4–8 weeks for initial audit and roadmap

Glossary

Conversion Rate
The percentage of visitors or users who complete a defined target action — such as a purchase, form submission, or sign-up — out of total visitors in a given period.
Conversion Funnel
The sequence of steps a user takes from first contact with a brand to completing the target action, with drop-off typically occurring at each stage.
A/B Test
A controlled experiment that shows two versions of a page or element (A and B) to randomly split audiences, then measures which version drives more conversions.
Hypothesis
A specific, testable statement predicting that a particular change will improve conversions for a defined reason, e.g., 'Adding a trust badge above the CTA will increase checkout starts by reducing payment anxiety.'
Statistical Significance
A threshold — typically 95% confidence — confirming that an observed difference in conversion rates between variants is unlikely to be caused by random chance.
Heatmap
A visual overlay on a web page showing where users click, scroll, and spend time, used to identify friction points and under-used elements.
Session Recording
A replay of an individual user's mouse movements, clicks, and scrolls on a page, used to identify confusing UI patterns or drop-off moments.
ICE Score
A prioritization framework rating each CRO hypothesis on Impact, Confidence, and Ease — each scored 1–10 — to rank which tests to run first.
Multivariate Test (MVT)
An experiment that tests multiple page elements simultaneously to identify the highest-converting combination, requiring significantly more traffic than a standard A/B test.
Micro-conversion
A small intermediate action — such as clicking a CTA, watching a video, or adding an item to a cart — that indicates progress toward the primary conversion goal.
Bounce Rate
The percentage of sessions in which a user leaves after viewing only one page without interacting, often used as a proxy for landing page relevance or usability problems.

Part of your Business Operating System

This document is one of 3,000+ business & legal templates included in Business in a Box.

  • Fill-in-the-blanks — ready in minutes
  • Compatible with all office suites
  • Export to PDF and share electronically

Create your document in 3 simple steps.

From template to signed document — all inside one Business Operating System.
1
Download or open template

Access over 3,000+ business and legal templates for any business task, project or initiative.

2
Edit and fill in the blanks with AI

Customize your ready-made business document template and save it in the cloud.

3
Save, Share, Send, Sign

Share your files and folders with your team. Create a space of seamless collaboration.

Save time, save money, and create top-quality documents.

★★★★★

"Fantastic value! I'm not sure how I'd do without it. It's worth its weight in gold and paid back for itself many times."

Managing Director · Mall Farm
Robert Whalley
Managing Director, Mall Farm Proprietary Limited
★★★★★

"I have been using Business in a Box for years. It has been the most useful source of templates I have encountered. I recommend it to anyone."

Business Owner · 4+ years
Dr Michael John Freestone
Business Owner
★★★★★

"It has been a life saver so many times I have lost count. Business in a Box has saved me so much time and as you know, time is money."

Owner · Upstate Web
David G. Moore Jr.
Owner, Upstate Web

Run your business with a system — not scattered tools

Stop downloading documents. Start operating with clarity. Business in a Box gives you the Business Operating System used by over 250,000 companies worldwide to structure, run, and grow their business.

Free Forever Plan · No credit card required