What’s the key ingredient for growing your B2B business without needing to acquire new customers? Customer retention. To make data-driven decisions, it’s important to track customer retention metrics and analyze trends and patterns.
Read on to learn how to measure customer retention, which metrics to track, how to calculate them, and why they’re important to your customer success strategy.
How to Measure Customer Retention
- Count the total number of customers you had at the end of a time period (month, quarter, or year).
- Subtract the number of new customers you acquired from the total number of customers.
- Divide this result by the number of customers you had at the start of the period.
- If you had 100 customers at the start, 90 customers at the end, and 5 new customers, your retention rate would be 85%.

Customer Retention Rate = (Customers at the End of the Period) – (New Customers Acquired) / Customers at the Start of the Period
Retention rate is sometimes confused with churn rate. However, these two metrics are distinctly different.
Churn Rate vs. Retention Rate
Retention rate is the ratio of customers that return to do business at your company. This differs from churn rate because churn rate refers to the number of customers you’ve lost over a period of time. A company with a high churn rate would, by default, have a lower retention rate.
Understanding the difference between these two metrics will prevent you from making a costly mistake down the road.
In fact, understanding all customer retention metrics can help you have a successful month, quarter, and year ahead.

Why are customer retention metrics important?
The more customers you retain, the more recurring revenue you can generate or the more upsells and cross-sells you can secure later. Plus, a customer who stays with you is happy with your products and services, increasing the likelihood that they’ll refer more customers to you.
But you can’t improve your customer retention unless you track metrics such as customer lifetime value and churn rate. Organizations track success in this area to see how well they are meeting customer needs and if they are continuing to earn their business over time.
Marketing, sales, customer service, and even product management teams can all benefit from customer retention data. This information helps each team fine-tune their contribution to the customer journey and create more delightful experiences for your user base.
But calculating this data can be time-consuming. And, if you’re like me, it can be frustrating trying to crunch numbers only to find the results don’t add up. That’s why we’ve created the calculator below to help your team gain accurate insights.
While there are plenty of metrics for your business can keep track of, we’ve curated a list of the most important ones below. Let’s take a look.

Customer Retention Metrics
- Customer Churn
- Revenue Churn
- Existing Customer Growth Rate
- Repeat Purchase Ratio
- Product Return Rate
- Days Sales Outstanding
- Net Promoter Score
- Time Between Purchases
- Loyal Customer Rate
- Customer Lifetime Value
1. Customer Churn

Perhaps the most straightforward of customer retention metrics, your company’s customer churn rate refers to the rate at which customers stop doing business with you. Whether the customer has ended or opted out of renewing a subscription, a churned customer is a customer that your business didn’t retain.
With that said, attrition in your customer base is natural to a certain degree. For example, a customer may have gone through a major change. Maybe their business was acquired or they went bankrupt. Maybe they no longer need your product or service.
But, if your annual churn rate is greater than 5-7%, it’s time to evaluate the happiness of your customers — and find out why there may be a problem. A high churn rate is typically indicative of your product or service failing to meet your customers’ expectations or goals.
How to Calculate Customer Churn
How frequently you calculate and examine your company’s churn rate will depend on the volume of business your company conducts. For example, if you have hundreds or thousands of customers, it may be prudent for your marketing, sales, or customer success team to track churn on a monthly basis.
If you have a relatively small customer list, a semi-annual or annual track will suffice. Note that new customers you onboard in whatever time period you choose should not be factored into the churn rate.
Churn Rate Formula
Annual Churn Rate = (Number of Customers at Start of Year – Number of Customers at End of Year) / Number of Customers at Start of Year
Example of Customer Churn
To calculate the churn rate, we can use the example metrics below.
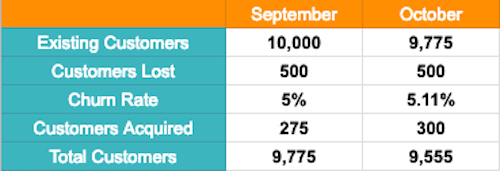
Let’s say our company started September with 10K customers. At the end of the month, we found that 500 left our business. This would mean our churn rate is five percent ((10,000 customers – 9,500 customers ) / 10,000 customer = 5%).
Now, let’s say we gained 275 customers during September and lost 500 more during October. Our churn rate for October would then be 5.11% ((9,775 customers – 9,225 customers) / 9,755 customers = 5.11%).
2. Revenue Churn Rate

Your revenue churn rate is the percentage of revenue you’ve lost from existing customers in a given period of time. For example, revenue churn can result from an order cancellation, a plan downgrade, or an end to a business relationship. Particularly for SaaS (Software as a Service) companies, revenue churn rate is a critical indicator of customer satisfaction.
While overall revenue churn rate provides a bird’s-eye view of customer health, it must be tracked on an individual basis. Your customer success team’s primary objective is to proactively ensure customers aren’t having problems using your product or service, let alone approaching the point where they downgrade their subscription.
If revenue churn does occur, it’s quite possible your customer may be on the brink of leaving — and your operations or services team must quickly take action to prevent this from happening.
How to Calculate Revenue Churn Rate
You should calculate the revenue churn rate in monthly intervals. Start with subtracting the monthly recurring revenue (MRR) at the end of the month from the MRR you had at the beginning of the month.
Then, subtract any revenue you accrued from upselling or cross-selling to existing customers. Finally, divide this number by the MRR you had at the beginning of the month.
You may, in fact, end up with a negative percentage, which would mean your revenue gains from existing customers outweighed any losses. But remember, revenue from new customers should not be included in this calculation.
Revenue Churn Rate Formula
Monthly Revenue Churn Rate = [(MRR at Start of Month – MRR at End of Month) – MRR in Upgrades during Month] / MRR at Start of Month
Example of Revenue Churn Rate
To demonstrate revenue churn rate, let’s use a similar example to the one we used above.
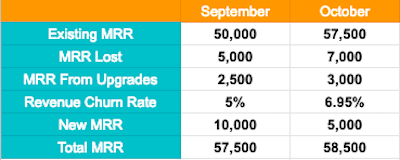
For this example, let’s say that our company began September with an MRR of $50K. In that month, we lost $5K to churn and gained $2.5K from upgrades. For this month, our revenue churn rate would be five percent. ([($50,000 – $45,000) – $2,500] / $50,000 = 5%).
For October, since we’ve gained $2.5K in upgrades as well as $10K in new MRR our starting MRR is going to be $57,500. If we lose $7K to churn and gain $3K to upgrades, our churn rate would be 6.95% ([($57,500 – $50,500) – $3,000] / $57,500 = 6.95%).
3. Existing Customer Revenue Growth Rate

Existing customer revenue growth rate is very important for your business.
A climbing rate would imply that your marketing, sales, and account teams are doing a great job at motivating customers to increase spending. It also means that your customers are quickly realizing the value of your engagement.
Conversely, a floundering or falling growth rate should put your success team on alert.
A stagnant existing customer revenue growth rate could also be dangerous for your business. After all, acquiring a new customer is actually four times more expensive than upselling a current one, thereby hampering your organization’s ability to scale.
If your existing customer accounts aren’t growing, you’re probably not spending enough time and budget on customer retention and failing to capitalize on easily tapped sources of revenue.
How to Calculate Existing Customer Revenue Growth Rate
Once again, the formula below should only take into consideration revenue generated from existing customers. No new sales are involved in this measurement. Existing customer revenue growth rate can be applied to a single account examined over a long period of time, or it can be measured to reflect the “big picture.”
Customer Revenue Growth Rate Formula
Monthly Revenue Growth Rate = (MRR at the End of Month – MRR at the Start of Month) / MRR at the Start of Month
Example of Existing Customer Revenue Growth Rate
For simplicity’s sake, let’s use the same example like the one above.
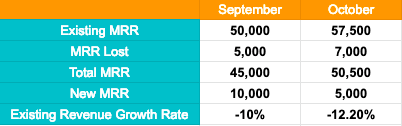
If we start September with an MRR of $50K then lose $5K to churn, our existing revenue growth rate is -10% (($45,000 – $50,000) / $50,000 = -10%). For October, if we start at $57.5K and lose $7K, our existing revenue growth rate is -12.2% (($50,500 – $57,500) / $57,500 = -12.2%).
4. Repeat Purchase Ratio

In simple terms, the repeat purchase ratio (RPR) is the percentage of customers that have returned to buy from your company again. This metric is a great indicator of customer loyalty — often used by marketing and sales teams to assess the performance and impact of the company’s customer retention strategy. Although this particular metric typically applies to products, you can also apply the same formula to repeat subscription or contract renewals.
What’s especially useful about repeat purchase ratios is their application to specific demographics. By taking a look at which types of consumers or companies are making the most repeat purchases, you can adjust your target buyer personas accordingly and inform marketing about where their efforts should be augmented or concentrated.
How to Calculate Repeat Purchase Ratio
This is a measurement that can be calculated in any timeframe — weekly, monthly, quarterly — and your customer success team will still find the data valuable.
In a B2B context, for example, you may sell a widget that’s used in the manufacturing process of several different customers who sell several different products. Each customer’s demand for your product may vary based on its own sales cycle, manufacturing procedures, etc. One new customer may make one large purchase order from you at the beginning of the year, while another may make purchases every month.
In this sense, the RPR should be taken with a small grain of salt. If your customer success team is really on its A-game, they’ll also benchmark purchasing frequency for each individual customer in addition to the overall repeat purchase rate.
Repeat Purchase Ratio Formula
Repeat Purchase Ratio = Number of Returning Customers / Number of Total Customers
Example of Repeat Purchase Ratio
Let’s say we start the month with 5K customers subscribing to our product or service. At the end of the month, only 4K of those customers return to our business. In this case, our repeat purchase ratio would be 80% (4,000 customers / 5,000 customers = 80%).
5. Product Return Rate

Another metric that applies specifically to companies that sell tangible products (as opposed to services or subscriptions), is your product return rate. This is the proportion of your total units sold that have been sent back to you.
Although products could be returned for myriad reasons, product returns are never good, and the ultimate goal is to keep this number as close to zero as possible.
While the B2C retailer’s average return rates for in-store and online purchases hover around 9% and 20% respectively, product returns in a B2B setting can be a bit more lethal. Given both the larger sales volume and extended duration of the average B2B sales cycle, product returns can be extremely problematic for your customer retention strategy. Customer service teams must quickly make amends before the sale (and/or customer) is lost entirely.
Product return rate is most certainly a data point that customer success teams must pay close attention to. Not only can customer success managers use it to justify reaching out to internal parties and jumpstarting the damage control process, but they can also use the information to let the right people know where the product or its delivery needs to be improved.
How to Calculate Product Return Rate
The timeframe for your product return rate will also depend on your sales volume. What’s effective for another company may not work for yours. But here’s the base formula and it’s important that whatever time period you choose to contextualize the calculation, you consistently adhere to it.
Product Return Rate Formula
Product Return Rate = Number of Units Sold That Were Later Returned / Total Number of Units Sold
Example of Product Return Rate
For this example, let’s say we’re a sporting goods company selling baseball cleats. In September, our most popular item sold 10K units, but 7K were returned later that month. Our product return rate would be 70%, which may indicate a significant problem with that shoe (7,000 units returned / 10,000 units = 70%).
6. Days Sales Outstanding

In a nutshell, days sales outstanding (DSO) can be described as the average number of days that receivables (customer dues, bills, payments) remain outstanding before they’re collected. DSO not only shows how well your company’s accounts receivables are being managed but also how committed a customer is to maintaining a healthy working relationship with your business.
The longer the DSO, the longer it’s taking customers to pay their bills — which may be a bad omen for your customer retention strategy. It’s important to look at DSO as a whole in order to identify trending behaviors and what you can do to combat DSO figures on the rise.
But on an individual basis, a lengthy DSO could mean your customer is dissatisfied with your company’s product or service, or that your marketing and sales teams are nurturing and closing customers with credit or cash flow problems. Remember, effective customer success strategies begin before the acquisition stage.
How to Calculate Days Sales Outstanding
DSO is usually applied to the entire set of invoices that a company has outstanding at any given time, rather than to a single invoice. You can determine your DSO on a monthly, quarterly, or annual basis by dividing the number of accounts receivable during the selected time period by the total value of credit sales during the same period. Then, multiply the result by the number of days in that timeframe.
The final figure is equated with the average number of days it takes your company to collect on an invoice. But for simplicity’s sake, we’ll use an annual DSO formula, which can be found below.
Days Sales Outstanding Formula
Annual Days Sales Outstanding = (Accounts Receivable / Annual Revenue) × 365 Days
Example of Days Sales Outstanding
Let’s say our hypothetical company made $100K in sales this year. Of that $100K, $75K has been collected. In this case, our annual DSO would be 274 days (($75,000 / $100,000) x 365 days = 274 days) and our monthly DSO would be 23 days (($75,000 / $100,000) x 31 days = 23 days). That could be low or high depending on the industry you’re working in.
7. Net Promoter Score® (NPS)

Net Promoter Score quantitatively measures general satisfaction and loyalty to your brand. Once you’ve calculated your overall Net Promoter Score, it will tell you if your customers are content and willing to refer your products or services to others.
What’s more, if you compare your Net Promoter Score to your revenue growth rate and customer churn rate, you may be able to predict potential growth through customer retention and referrals.
While a high NPS does not guarantee growth and retention, identifying and incentivizing brand evangelists can help drive referral business. This can work exceptionally well alongside content marketing initiatives such as the creation of case studies, website testimonials, and other forms of social proof.
Conversely, a poor or middling score provides the opportunity to address a satisfaction problem before it’s too late.
How to Calculate Net Promoter Score
As simple as it may sound, this score is determined by asking your customer one question: “How likely are you to recommend our company to a friend or colleague?”
That’s it! The customer is then prompted to choose a score between 0 and 10. Note that only 9’s and 10’s are promoters, and any customer giving a rating of 6 or below is considered to be a detractor.
If you feel it would be helpful, you can ask a follow-up question in your NPS survey (something along the lines of “Will you share why?”) — but keep in mind that response rates decrease as the number of questions asked increases.
Then, you can calculate Net Promoter Score by subtracting the percentage of detractor responses from the percentage of promoter responses.
Net Promoter Score Formula
Net Promoter Score = % of Promoters – % of Detractors
Example of Net Promoter Score
A smart company would distribute an NPS survey after a customer service case is resolved. If after a month, we observed 50 promoters, 25 neutral scores, and 10 detractors, our overall NPS would be 47 (50/85 = 59%, 10/85= 12%, 59% – 12% = 47).
8. Time Between Purchases

Time between purchases measures the time it takes for an average customer to buy from you again. This is an important retention metric because it shows you how happy customers are with your product or service and how willing they are to try competitors in your market.
When tracking this metric, it’s important to compare it to other metrics like customer satisfaction and NPS. For example, if you’re noticing a lot of time between purchases, that may indicate that your product or service isn’t differentiating itself from others in its industry. Or, it could mean that your product is well-built, and customers don’t need to buy it again. Comparing time between purchases with other customer satisfaction metrics is a great way to identify overall strengths and weaknesses in your offer.
How to Calculate Time Between Purchases
To calculate the average time between purchases, you’ll need to keep track of the purchase dates for all customers. A CRM can help you do this, as it can set up contact properties that record whenever customers make repeat purchases.
Once you have a recording system, you’ll need to add together every customer’s average purchase rate. For example, if a customer buys from you today, then buys another product a week from now, their purchase rate would be seven days. If they bought from you again two weeks later, then their average purchase rate would be 10.5 days.
After finding the sum of all individual purchase rates, divide that number by your total
repeat customers. Be sure to exclude any new customers, as this metric should only measure your existing ones who made repeat purchases.
Time Between Purchases Formula
Time Between Purchases = Sum of Individual Purchase Rates / Number of Repeat Customers
Example of Time Between Purchases
For this example, it’ll be easier to explain calculations using the Excel sheet below.

In September, our small business only had five repeat customers. By calculating the average purchase rate for each individual customer, we can see how long it took for each one to purchase from us again. Averaging these numbers together leaves us with an average time between purchases being 8 days (40 days / 5 customers = 8 days).
9. Loyal Customer Rate

Loyal customer rate simply refers to the number of customers who have made a repeat purchase with you within a given time range. Since your most loyal customers buy from you the most, this metric identifies the percentage of your customer base that’s demonstrated loyalty to your business.
It’s important to know how many loyal customers you have because these people are the most valuable members of your customer base. That’s because they not only drive the most sales, but they’re also the most likely to share positive word-of-mouth about your business. By knowing who these loyal customers are, you can capitalize on opportunities to gather testimonials and encourage customer advocacy.
How to Calculate Loyal Customer Rate
Loyal customer rate is calculated by first identifying the total number of customers that your business had during a given month, quarter, or year. This includes both existing customers and new ones.
Then, you need to find both the number of existing customers who made an additional purchase and the number of new customers who made multiple purchases. Add those values together to get your total number of loyal customers.
Finally, divide your total number of loyal customers by your total customers to get your loyal customer rate.
Loyal Customer Rate Formula
Loyal Customer Rate = Number of Repeat Customers / Total Customers
Example of Loyal Customer Rate
In this example, let’s say we had 20K total customers during September. Of that 20K, 2K were existing customers who made additional purchases and 3K were new customers who made multiple purchases. By averaging these values together, we would find that our loyal customer rate comes out as 25% ((2K customers + 3K customers) / 20K customers = 25%).
10. Customer Lifetime Value

Customer lifetime value (CLV) measures how much revenue is generated by a single customer. Whether you sell individual products or services, or you sell software billed annually, this is a metric to track consistently. Ideally, you’d see CLV rise or stay constant, as a shrinking CLV suggests you’re either capturing low-value customers or losing customers faster than you had in the past.
How to Calculate Lifetime Value
First, determine the average revenue amount you can expect from a customer over the course of a year. You determine this number by dividing your gross annual sales by the total number of unique customers in that year.
Then, you’ll want to determine how long a customer stays with your business in terms of years.
From there, you’ll multiply the average revenue per customer by the average lifespan of the customer to produce your customer lifetime value.
Customer Lifetime Value Formula
Customer Lifetime Value = Customer Value * Average Customer Lifespan
where Customer Value = Average Purchase Value * Average Number of Purchases
Example of Customer Lifetime Value
A SaaS company bills customers annually for software. The company took in $5 million in revenue last year and has 2,000 customers. Dividing its revenue of $5 million by its current customer base of 2,000 produces an average revenue of $2,500 per customer per year.
The company analyzed its customer longevity and discovered the average amount of time a customer does business with the software company is three and a half years.
Multiplying the average revenue of $2,500 by the average lifespan of four and a half years yields a customer lifetime value of $11,250.
While these are the top metrics you should be tracking for customer retention, there’s more data you can analyze to improve your customer experience. Let’s wrap up by exploring those alternatives in the section below.
More Customer Retention Metrics to Consider
Depending on your business goals and the interactions you expect from customers, there may be a few more metrics that will benefit your customer success team.
For example, looking at the number of open tickets or the number of complaints a customer has filed could prompt your success team to work on a solution. If regular communication and engagement with your customers is the norm for your business, it would be wise to measure your email open rates and response rates.
What’s important is that you can quantify the values, record them using the right technology, and give each department access to real-time data should they need to address a problem with a customer.
The Importance of Customer Retention
It’s imperative that your company allocates time and resources to improving customer retention. If putting together comprehensive customer retention or success plan currently feels out of reach, then start small. Begin tracking the metrics mentioned here, and your customer base will grow exponentially.
Prepare your SaaS business for growth before you need it
Following these ten steps can improve your application’s ability to scale, and your SaaS company’s ability to grow and expand.